Author Archives: Scalper1

Pampa Energía Is A Good Option For Normalization In Argentina
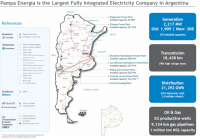
Summary Pampa Energía works in a highly distorted regulatory framework, where frozen tariffs have led to a critical situation for the utility companies. Even in this scenario Pampa Energía has managed to reach a price earning of 5 years. With a new government about to be elected, great improvements could be in the way. Pampa Energía S.A. (NYSE: PAM ) is the largest integrated electricity company in Argentina and through its subsidiaries participates in the generation, transmission and distribution of electricity, as well as natural gas transportation and production. (click to enlarge) Source: Pampa Energía. Pampa Energía owns indirectly: 84% of the generation assets. 26% of the transmission business (TRAN.BA). 52% of the distribution business with Edenor (EDN). 26% of the natural gas transportation business with Transportadora de Gas del Sur (NYSE: TGS )(pending government approval). 50% of the Oil and Gas exploration and production business with Petrolera Pampa (PETR.BA), associated with Yacimientos Petrolíferos Fiscales (YPF). As of August 17th, 2015 the market cap of the above mentioned: (click to enlarge) Source: Yahoo Finance Reminder: Transener and Petrolera Pampa stocks are only listed in the Merval Index, the market cap is expressed in Argentine Pesos -AR$-. Exchange rate as of August 17th: ARS/USD= 9.15. Updated quotes and market cap expressed in USD here . Scenario: Pampa Energía works in a highly distorted regulatory framework where frozen tariffs have led to a critical situation for the utility companies. From 2001 onwards the tariff was converted to AR$ and had practically no adjustments and no longer provides for a reasonable return on capital/assets. Full tariff reviews are pending. High inflation and regulated tariffs that took place since 2006 and 2001 respectively, have led to deep margin erosion for utility stocks. The Argentine utility stocks have underperformed their Latam and EM peers since 2001, these poor returns are explained by significant erosion in real electricity tariffs (frozen since 2001). Gross margin captured by utilities as a percentage of the GDP fall from 0.3% to 0.02%, setting the scope for a possible recovery in profits, if the upcoming political situation leads to a normalization of the current imbalances. For example, the comparison between the residential electricity cost in Argentina and regional peers shows clearly how distorted the public services tariffs are. (click to enlarge) Source: Pampa Energía. Subsidies for electricity and gas purchases cost the government around 4.5% of GDP, and the burden is growing. Some tariffs would need to triple or even be multiplied by seven times to reach market prices. With just a small correction, companies like PAM will perform better. A presidential election is coming in Argentina as of October 25, and the main contenders (Daniel Scioli, Mauricio Macri and Sergio Massa) have expressed its understanding about the need to lift some tariffs caps, in order to reduce the fiscal deficit, which is unsustainable at these levels. As the company’s aren’t capable of fulfilling the investment needs in electricity of the country, and several blackouts occur during the last quarters, the actual government is taking some measures to improve the situation. Two relevant facts take place during 2Q15 for Pampa Energía: 1) “SE Resolution No. 482/15: Increase in the Electricity Generation Remuneration Scheme On June 10, 2015, the Secretariat of Energy issued SE Resolution No. 482/15, in which it updates retroactively the remuneration for electricity generation as of February 2015 commercial transactions.” 2) “Gas Transportation Tariff Increase for Transportadora de Gas del Sur S.A. On June 8, 2015, the National Gas Regulatory Authority -ENARGAS- issued Resolution No. 3,347/15, which grants TGS a tariff increase for gas transportation and operation and maintenance fees of 44.3% and 73.1%, respectively, both retroactive to May 2015.” Source: Pampa Energía 2Q15. This and other measures have improved Pampa´s EBITDA and Profits. In the 2H15 : Consolidated sales revenues of AR$3,457.6 million ($378 million) for the six-month period ended on June 30, 2015, 18.4% higher than the AR$2,921.4 million ($319 million) for the same period of 2014. Adjusted consolidated EBITDA of AR$1,693.3 million ($185 million) for the six-month period ended on June 30, 2015, compared to AR$27.1 million ($9 million) for the same period of 2014. Consolidated profit of AR$1,365.1 million ($149 million) during the six-month period ended on June 30, 2015, of which a profit of AR$963.0 million ($105 million) is attributable to the owners of the company, compared to an AR$80.4 million loss (-$8.8 million) attributable to the owners of the company in the same period of 2014. With a market cap of $900 million, earnings per ADR in the 1H15 of $1.7, and foreseeable earnings of nearly $180 million a year, the forward P/E looks compelling. Just thinking about the replacement cost of its fixed assets, it´s easy to see how PAM is undervalued, and this is mostly caused by a regulatory environment which could improve soon. As a change in the government is approaching, it could be expected that some distortions will disappear, I´m not talking here about free market prices, as it´s “politically incorrect” to raise tariffs by 200% in a single move, but given the current situation, where PAM is trading at a forward P/E of 5, and making money under this difficult scenario, any improvement will boost earnings and improve the company´s situation. Risks: Currency risks are present since it’s widely expected that the new government will depreciate the local currency, but that depreciation will certainly include better tariffs for the utilities as the energy price is partly dollar linked as well as the importations of energy. Political risks are another factor to bear in mind, but as the current government deficit is unsustainable, some adjustments are needed. To conclude PAM is under the current conditions deeply undervalued, and that could increase if the pending integral tariff revision comes in place. If the Argentinean economy is going to improve, massive capex in the electricity sector would be needed, and PAM is in the better position to profit from that. Disclosure: I/we have no positions in any stocks mentioned, but may initiate a long position in PAM over the next 72 hours. (More…) I wrote this article myself, and it expresses my own opinions. I am not receiving compensation for it (other than from Seeking Alpha). I have no business relationship with any company whose stock is mentioned in this article.

How I Diversify And Hedge My Portfolio For Market Volatility

Wide diversification and a ‘buy and hold’ strategy are not necessary for success. In fact, there are much better ways to hedge the market, capitalize on upside, and protect yourself from downside. Here is how I diversify my portfolio. Wide diversification is only required when investors do not understand what they are doing.” – Warren Buffett Every couple weeks I list my portfolio along with top-rated stocks to members of Tipping the Scale. I do this because my holdings often change depending on stock gains, valuation, and when new opportunities arise. Soon after my last update, a person noted that I did not own any materials, utilities, and was very light on industrial stocks and ETFs. He continued that for a portfolio of my size, he was surprised I did not prioritize “diversification”. My response is that I do diversify, just differently, and that my intention is not to track the market, but to rather beat the market. With well over a decade of consistency, my bottom line approach has not changed much, having worked very well in all markets. Here’s what I do. Rather than prioritizing industries and sectors of the market to achieve diversification, I diversify by purpose. Each holding in my portfolio fits into one of five categories, my sectors if you will, and thereby having a purpose. That category dictates management style, selection, and activity. Here are the five categories and the weight that each has in my portfolio Category Weight Top rated stocks 35% Dividend & Income Stocks 30% Deep Value 10% Growth & Momentum 5% Cash 20% Top-rated stocks are those that score in the upper echelon of companies covered in Tipping The Scale. Typically these are stock that score 88 or higher, meaning the company had to score relatively high in all 10 categories that TTS tracks. These include business growth, macro outlook, profitability, management vision, valuation, etc. Due to such a high rating, my theory is that “top-rated stocks” are worth holding through volatility, and should not be sold, only acquired in periods of loss until the company’s rating starts to decline. In the first three months of TTS, top-rated stocks (seven stocks with a score better than 90) traded higher by more than 9% versus a loss of 1% in the S&P 500. Therefore, these stocks tend to perform well both in short and long term, which is why they are such a staple in my portfolio. For investors considering my portfolio strategy, 35% of your holdings would be allocated to those stocks where you have the most confidence, and are the best of the best, however it is that you determine “the best”. Dividend And Income stocks provide some balance to my portfolio, as these are typically low beta, safe investments. Seeing as how 40 of the potential 100 points for TTS stocks are tied to business growth, macro outlook, and the amount of short and long-term upside in a stock, large companies with high dividends don’t typically rank as “top rated stocks”. Therefore, I hedge those types of investments with stocks that don’t necessarily have tons of upside or growth (i.e. AT&T (NYSE: T ) or Corning (NYSE: GLW )) but have high yields. These are companies that would rank high in other areas, but just don’t have the growth upside of a top-rated stock. Furthermore, this is where I put REITs like the Vanguard REIT Index Fund (NYSEARCA: VNQ ) and ETFs that have high yields. The key with the dividend and income section is to invest in entities that pay a high yield. The average yield of my holdings that fit into this section is 4.6%. With 30% of my portfolio allocated to dividend and income, that 4.6% yield for 30% of my portfolio translates to a 1.4% yield for the entire portfolio. Not to mention, often times a company that pays a dividend will fit into another category, thereby not considered part of the dividend & income section. A good example is Apple (NASDAQ: AAPL ) and Schlumberger (NYSE: SLB ), which fit into the top rated and deep value sections of the portfolio, respectively. All in all, the yield of my total portfolio is 1.8%, just about equal to the SPDR S&P 500 ETF Trust (NYSEARCA: SPY ). That gives me a downside cushion while also hedging my top rated holdings. With that said, the top rated stocks and dividend & income sections serve as a natural hedge against the other, limiting downside risk in the face of a market correction. The Deep Value and Growth And Momentum sections tend to do the same. Albeit, I don’t worry about how many holdings in each sector are in my portfolio, but by allocating my portfolio based on goals, you end up owning stakes in most industries. For example, energy and financial stocks trade at the lowest multiples and are mostly cheap because of macro-related factors, whether it be oil prices or low interest rates. This gives investors an opportunity to cherry pick top companies in those respective industries, those that have fallen below their worth because of macro-related concerns. My belief is that once those macro-related concerns stabilize, those top companies like Schlumberger, EOG Resources, JPMorgan (NYSE: JPM ), and Goldman Sachs (NYSE: GS ) will be the ones to outperform their peers. However, if those macro factors don’t improve, then not much of your portfolio is tied to such stocks. That said, there is certainly no valuation considerations for stocks included in my growth and momentum section. This is where I own companies like FireEye (NASDAQ: FEYE ), Facebook (NASDAQ: FB ), or speculative biotechnology companies. As explained in a recent blog , this is where I trade stocks based on their score in TTS. This is where I buy momentum stocks when volatility makes them cheap, and then sell when that price gets too high. Notably, if the market turns for the worse, these are usually the first stocks to go lower, and that’s why when owning such stocks it is good to keep a close eye and set stern stop-loss and limit orders. Finally, I keep a cash stake that equates to 20% of my total portfolio, which too fluctuates depending on the performance of the market. Believe it or not, cash is where investors can really hedge the performance of the market, and use volatility to their advantage. Below is a chart that I follow as a way to determine the size of my cash stake. Cash as percentage of portfolio S&P 500 performance 15% bull market 20% 2% to 5% off highs 25% 5% to 8% off highs 30% 9% to 12% off highs 35% 13% to 30% off highs 50% 31% or more off highs We are coming off a five year bull market that has seen very little economic growth, one that I fear has been driven by lower interest rates and multiple expansion. I have said on many occasions that I expect a correction. The problem is that there’s no way to know when that correction will come or how bad it will be. So, when the market starts to dip, I start cutting my growth and momentum stocks. If it keeps falling, I will trim value stocks that are hurt by macro conditions. Finally, if the market keeps going lower, surpassing that 30% from market high levels, I will start cutting dividend stocks. However, unless something changes the outlook for those high rated stocks, I will not sell, not until my price target is reached. With that said, this is a hedge that I have found to be very useful over the years. For one, both times that the market has exceeded a loss of 30% off its high since the year 2000, it continued to dip significantly lower. Therefore, I protect myself from future losses, and by quickly increasing my cash position and removing high beta stocks, while retaining low beta stocks (dividend), my portfolio tends to outperform the market. Then, by decreasing cash and increasing my stake in high beta momentum stocks, my gains tend to outperform the broader market as it recovers. However, the final and most important piece of the puzzle are those high rated stocks, because as I already explained, those stocks consistently outperform the market due to having the total package in those 10 essential categories. All things considered, the buy-and-hold, complete diversification strategy by owning all industries of the market is not a bad way to structure a portfolio, but I don’t think it is the best way, and neither does Warren Buffett. Instead, it is best to determine what you want from a portfolio, and then create it from those goals. Over the years, as my net worth has grown larger, I’ll be the first to say that my appetite for risk has diminished, and where I used to own more momentum stocks, I have since found high yield to be most important. However, the one thing that has not changed is my desire to own as many high quality companies as possible. In any market, those are the ones that thrive, and that’s why I would tell anyone to diversify by owning what’s best, and not to own a little piece of everything. Disclosure: I am/we are long AAPL, GS, T, JPM, SLB, GLW. (More…) I wrote this article myself, and it expresses my own opinions. I am not receiving compensation for it (other than from Seeking Alpha). I have no business relationship with any company whose stock is mentioned in this article.

Market Lab Report – Premarket Pulse 8/20/15

Major averages sold off ahead of the release of the Fed’s meeting minutes yesterday then rallied back only to do another about face and head lower once again to finish down on higher volume. The number of distribution days is at nosebleed levels but that has been a less reliable indicator in this QE environment. Most Federal Reserve officials thought economic conditions needed for a rate hike were “approaching”, thus making a September rate hike a possibility. “Most judged that the conditions for policy firming had not yet been achieved, but they noted that conditions were approaching that point,” according to the minutes. Those in favor of a rate hike said an appreciable delay in a tightening monetary policy would spark inflation or financial instability. By contrast, only a minority of Fed officials counseled patience, noting that there were no grounds to think inflation would move back to the 2% annual target, particularly because of the strong dollar and recent drop in crude oil prices. So while this Fed-speak implies more Fed members are pushing for a rate hike since the economy is “apparently” showing enough improvement to warrant such a hike, it ultimately depends on the strength of the recovery which is still quite suspect, and therefore allows the Fed to further postpone any rate increase on the basis of a stagnant economy. Commodities/oils continue to plummet at a pace not seen since late 2008 shortly before the crash. Short-sale target Tesla Motors (TSLA) reversed yesterday right at the 50-day moving average. Near-term we look for a downside objective of 232.74, the low of seven trading days ago. In a prolonged market decline, however, the stock could go much lower. The 50-day moving average plus 2-3% of upside porosity remains the primary guide for an upside stop on any short position taken yesterday morning when our SSS report on the stock was released.