Scalper1 News
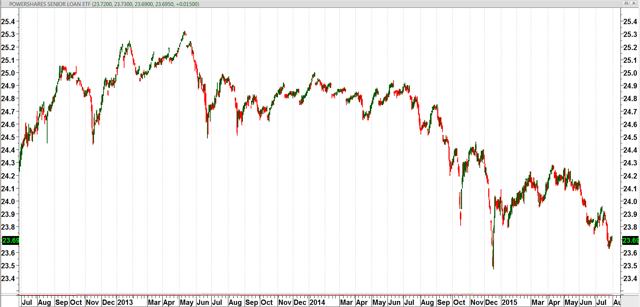
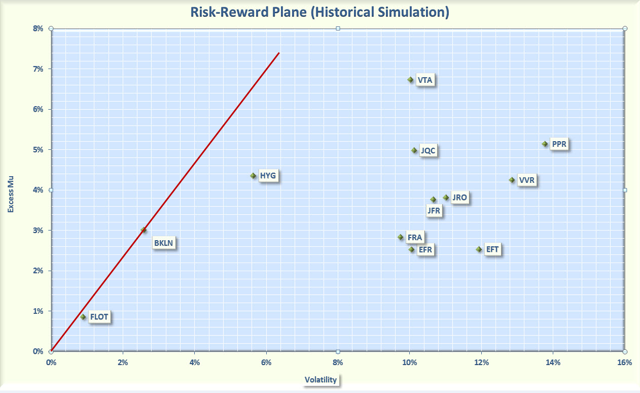
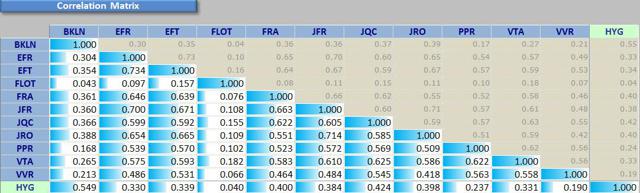
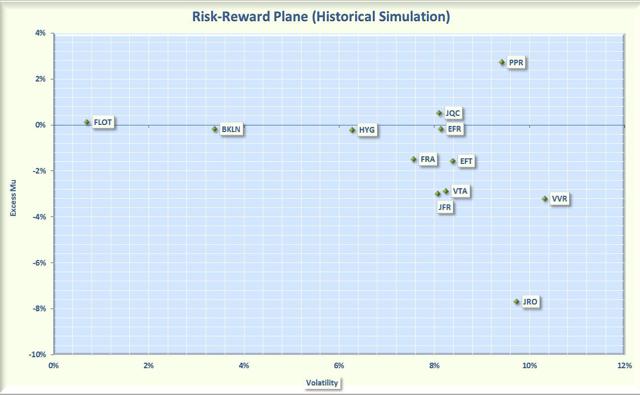 Summary Floating rate loans are typically viewed as a hedge against rising interest rates and are a good way to diversify a fixed income portfolio. Floating rate loans CEFs provide excellent income with distribution between 6% and 8% but their risk-adjusted performance has not kept pace. With a few exceptions, floating rate ETFs have outperformed CEFs on a risk-adjusted basis. As a retiree, I am always searching for sources of high income but lately I have worried about rising interest rates. Floating rate loans appeared to offer the best of both worlds, providing good income plus a hedge against increased rates. However, about seven months ago I wrote an article advising caution when investing in this asset class since rewards were not commensurate with risk. The reason was that interest rates had unexpectedly dropped, putting pressure on these loans. But now the Federal Reserve appears to be poised to increase rates within the next few months. So now may be a good time to consider floating rate loans for your portfolio. This article will explore the risk versus rewards of floating rate loan funds and provide data to help you assess which investments are best. There are many ways to define best. Some investors may use total return as a metric, but as a retiree, risk is as important to me as return. Therefore, I define “best” as the fund that provides the most reward for a given level of risk, and I measure risk by the volatility. I am not advocating that this is the way everyone should define best; I am just saying that this is the definition that works for me. For those that have not read my previous article, I will summarize some of the more important characteristics of floating rate loans (also called senior loans). First off, these are loans usually made to below investment grade companies to support business purposes, such as expansion. The loans are typically large, with sizes in the $50 million to over a billion dollar range. They are called “senior” loans because they are backed by real assets and are the first to be paid when a company pays its debts. The loans are also known as “floating rate” because the rate of interest is adjustable and moves higher or lower based on a benchmark, usually the London Interbank Offer Rate (Libor). The Libor is the rate banks pay one another to borrow funds and the rate depends on when the loan is due, either 30, 60, or 90 days. The interest rate paid by a floating rate loan is calculated as a “spread” over the Libor. The spread on the loan does not change but the Libor can change daily in response to market conditions. Floating rate loans have a “reset period” that determines how frequently the interest rates are synced with the Libor. The reset varies from loan to loan but a diversified portfolio of loans will typically have a reset period that averages about 60 days. Thus, the interest earned on floating rate loans is responsive to changes in short-term interest rates. Floating rate loans are different than high yield bonds. When interest rates go up, the price of a high yield bond go down but the amount of interest paid is always the same. The opposite happens to a floating rate loan. When interest rates change, the interest on this type of loan is adjusted but it seldom impacts the price of the loan. Also since these loans are secured by assets of the company, senior loans recover an average of about 70% of face value if the company files for bankruptcy. This is much better than the 40% average recovered by high yield bonds. The bottom line is that floating rate loans have a number of characteristics that make them well suited if interest rates are expected to rise. However, the following are some observations investors should think about before investing. Floating rate loans are tied to short-term rates, usually the 3 month Libor, which has barely moved over the past year. Today the Libor is 0.28%, which is up only 5 basis points from a year ago. Even when rates begin to rise, floating rate loans may not immediately follow suit. The reason is that many floating rate loans have a floor, for example, the rate may be stated as 2% above the Libor but with a floor of 3%. In this case, if the Libor increases from 0.28% to 1%, the 3% floor will still be in effect at and the interest paid of the floating rate note would not have changed. In recessionary environments, floating rate loans funds can lose significant value. For example, floating rate loans funds had a terrible year (along with most other assets) in 2008, with Net Asset Values falling on average by about 50%. With these caveats in mind, let’s look at the performance of floating rate loans. The easiest way to invest in floating rate loans is by either an Exchange Traded Fund (ETF) or a Closed End Fund (CEF). Floating rate loans ETFs have a relatively short history (the first was launched in 2011) so I will limit my analysis to the ETFs that have at least a 3 year history. The following two ETFs satisfy my criteria: iShares Floating Rate Bond (NYSEARCA: FLOT ). This ETF tracks the Barclay’s Capital U.S. Floating Rate Note index, which contains investment grade securities with a maturity of 5 years or less. The ETF was launched in June, 2011 and has 436 securities. This fund is unusual in that the portfolio is investment grade, which reduces both the yield and the volatility. The expense ratio is 0.2% and the yield is only 0.46%. PowerShares Senior Loan Portfolio (NYSEARCA: BKLN ). This ETF tracks S&P/LSTA U.S. Leveraged Loan 100 Index, which is an index designed to mirror the market-weighted performance of the largest institutional leveraged loans. This ETF was launched in March, 2011. The portfolio consists of the 100 largest loans in the senior loan space. This fund has a yield of 3.9% and an expense ratio of 0.65%. Figure 1 plots the performance of BKLN over the past 3 years and illustrates the difficulty senior loan prices have experienced during the past 12 months. (click to enlarge) Figure 1: Price of BKLN Another way to invest in floating rate securities is via CEFs. CEFs differ from ETFs in several ways including: CEFs are actively managed while ETFs typically track an index CEFs may sell at a significant premium or discount to Net Asset Value (NAV) while ETFs usually sell at prices close to NAV. This often results in increased volatility for CEFs since prices may vary even though the NAV does not change. CEFs often use leverage to enhance performance. In a floating rate bull market, this can be a positive factor but may also result in increased losses when the bear returns. There are current 27 senior loan CEFs listed on the CEFConnect website. To reduce the number of funds to be analyzed, I selected candidates based on the following criteria. At least 3 years of history Market Cap greater than $400 million. Average trading volume greater than 100,000 shares per day. The following 9 funds satisfied all of these conditions. Nuveen Credit Strategy Income (NYSE: JQC ). This CEF sells for a discount of 13.1%, which is larger than the 3 year average discount of 6.6%. The fund has a distribution of 7%, none of which was from Return of Capital (ROC). The fund has 373 holdings, with 76% in floating rate loans and 20% in high yield bonds. JQC utilizes 37% leverage and has an expense ratio of 1.8%, including interest payments. This fund was launched in 2003 as a multi-sector fund but the strategy changed in early 2012 to a floating rate fund. Voya Prime Rate Trust (NYSE: PPR ). This CEF sells for a discount of 8%, which is larger than the 3 year average discount of 2.1%. The fund has a distribution of 6.2%, none of which is from ROC. The fund has 400 holdings, virtually all in senior loans and 91% from U.S. companies. PPR utilizes 29% leverage and has an expense ratio of 2.1%, including interest payments. Invesco Van Kampen Dynamic Credit Opportunities (NYSE: VTA ). This CEF sells for a discount of 12.5%, which is larger than the 3 year average discount of 5.9%. The fund has a distribution of 7.8%, none of which was ROC. The fund has 581 holdings, with 78% in floating rate loans. About 30% of the holdings are from non-U.S. companies. VTA utilizes 33% leverage and has expense ratio of 2.5%, including interest payments. Invesco Van Kampen Senior Income (NYSE: VVR ). This CEF sells for a discount of 10.3%, which is larger than the 3 year average discount of 2.6%. The fund has a distribution of 7%, with only a small amount (less than 5%) coming from ROC. The fund has over 573 holdings, with 89% in floating rate loans. Almost all the securities are from U.S. companies. VVR utilizes 31% leverage and has an expense ratio of 2.2%, including interest payments. Nuveen Floating Rate Income Opportunities (NYSE: JRO ). This CEF sells for a discount of 10.6%, which is larger than the 3 year average discount of 2.3%. It has a distribution of 7%, none of which was from ROC. The fund has 281 holdings, with 78% in floating rate loans and 11% in high yield bonds. All the securities are from U.S, based companies. JRO utilizes 38% leverage and has an expense ratio of 2.1%, including interest payments. Nuveen Floating Rate Income (NYSE: JFR ). This CEF sells for a discount of 11.6%, which is larger than the 3 year average discount of 3.9%. It has a distribution of 7%, none of which was ROC. The fund has 281 holdings, with 78% in floating rate loans and 11% in high yield bonds. All the securities are from U.S. based companies. JFR utilizes 38% leverage and has an expense ratio of 2.1%, including interest payments. Eaton Vance Senior Floating Rate (NYSE: EFR ). This CEF sells at a discount of 8%, which is larger than the 3 year average discount of 1.8%. The distribution is 6.8% with only a small amount (less than 5%) from ROC. The fund holds 901 securities, with 88% in floating rate loans. About 83% of the securities are from U.S. companies. EFR utilizes 26% leverage and has an expense ratio of 1.7% including interest payments. Eaton Vance Floating Rate Income (NYSE: EFT ). This CEF sells at a discount of 9.5%, which is larger than the 3 year average discount of 2.5%. The distribution is 6.5% with no ROC. The fund holds 898 securities with 88% in floating rate loans. About 84% of the securities are from U.S. companies. EFR utilizes 37% leverage and has an expense ratio of 2.2% including interest payments. BlackRock Floating Rate Strategies (NYSE: FRA ). This CEF sells at a discount of 11.8%, which is larger than the 3 year average discount of 4.2%. The distribution is 6.1% with a small amount (about 10%) coming from ROC. The fund holds 459 securities, with 92% in floating rate loans. All of the securities are from U.S. companies. FRA utilizes 29% leverage and has an expense ratio of 1.5% including interest payments. For comparison with bonds, I also included the following ETF in the analysis: iShares iBoxx $ High Yield Corporate Bonds (NYSEARCA: HYG ). This ETF tracks the performance of high yield corporate bonds. It yields 5.5% and has an expense ratio of 0.5%. To assess the risk versus reward of these floating rate funds over the past 3 years, I plotted the annualized rate of return in excess of the risk free rate (called Excess Mu in the charts) versus the volatility of each of the funds. To better illustrate the annual returns, I used 0% as the risk free rate. The Smartfolio 3 program was used to generate the plot that is shown in Figure 2. (click to enlarge) Figure 2. Risk versus reward over past 3 years As is evident from the figure, the funds have had a wide range of returns and volatilities. To better assess the relative performance of these funds, I calculated the Sharpe Ratio. The Sharpe Ratio is a metric developed by Nobel laureate William Sharpe that measures risk-adjusted performance. It is calculated as the ratio of the excess return over the volatility. This reward-to-risk ratio (assuming that risk is measured by volatility) is a good way to compare peers to assess if higher returns are due to superior investment performance or from taking additional risk. In Figure 2, I plotted a red line that represents the Sharpe Ratio associated with BKLN. If an asset is above the line, it has a higher Sharpe Ratio than BKLN. Conversely, if an asset is below the line, the reward to risk is worse than BKLN. Some interesting observations are apparent from Figure 1. Both floating rate ETFs (FLOT and BKLN) exhibited low volatilities relative to high yield bonds Most floating rate CEFs had higher absolute returns than BKLN but also significantly higher volatilities. On a risk-adjusted basis, BKLN easily beat the CEFs. FLOT and BKLN had essentially the same risk-adjusted performance. All the floating rate CEFs were more volatile than high yield bonds. Only VTA is close to HYG in terms of risk-adjusted performance. On a relative basis, VTA had the best risk-adjusted performance among the CEFs and EFT had the worst. PPR was the most volatile fund but also had a relatively high return. PPR was the third best among the CEFs. . Floating rate loans have also been touted as providing portfolio diversification. To be “diversified,” you would choose assets such that when some assets are down, others are up. In mathematical terms, you want to select assets that are uncorrelated (or at least not highly correlated) with each other. To assess the diversification potential of floating rate loans, I calculated the pair-wise correlations associated with these funds. The results are shown in Figure 3. (click to enlarge) Figure 3. Correlation matrix over the past 3 years. The figure presents what is called a correlation matrix. The symbols for the funds are listed in the first column on the left side of the figure. The symbols are also listed along the first row at the top. The number in the intersection of the row and column is the correlation between the two assets. For example, if you follow VVR to the right for three columns you will see that the intersection with EFT is 0.531. This indicates that, over the past 3 years, VVR and EFT were only 55% correlated. Note that all assets are 100% correlated with themselves so the values along the diagonal of the matrix are all ones. As shown in the figure, none of the assets were highly correlated with each other or with high yield bonds. Most of the senior loan funds had correlations with each other in the 30% to 60% range. The correlation with high yield bonds was a little lower, ranging from about 25% to 55%. Note also that FLOT had very low correlations with the other assets. So overall, floating rate loans funds did provide excellent diversification. As a last analysis, I reduced the look-back to the last 12 months and the results are shown in Figure 4. This figure verifies that the past year has not been kind to floating rate loans. During this period, only PPR and JQC were able to book positive returns. The ETFs, including high yield bonds, were able to break even. Most of the other CEFs were underwater. (click to enlarge) Figure 4. Risk versus reward over past 12 months Bottom Line As often happens when analyzing asset classes, the “best” floating rate investment depended on your time frame and risk tolerance. From a distribution point of view, CEFs offer high income. However, CEFs are volatile and they faltered when adjusted for risks. Of the CEFs, PPR and JQC performed the best over the last 12 months and had reasonable performance over the entire 3 year look-back period. In terms of ETFs, I like BKLN over FLOT. FLOT is safe as you would expect from short term investment grade assets. However, I believe BKLN offers a best choice if you are willing to take slightly more risk. Floating rate funds are a unique asset class that provides investors with current income and diversification. If the Fed is indeed planning to begin raising rates, floating rate loans should be high on the list of attractive fixed income investments. This is especially true if the economy is expanding so that below-investment-grade companies are not as likely to default. However, there does not appear to be much demand for floating rate loans from retail investors. This is evidenced by the decrease in price of floating rates assets and the widening of discounts associated with CEFs. Thus, I would continue to be cautious until prices of these assets begin to rise. Disclosure: I/we have no positions in any stocks mentioned, and no plans to initiate any positions within the next 72 hours. (More…) I wrote this article myself, and it expresses my own opinions. I am not receiving compensation for it (other than from Seeking Alpha). I have no business relationship with any company whose stock is mentioned in this article. Scalper1 News
Scalper1 News