Scalper1 News
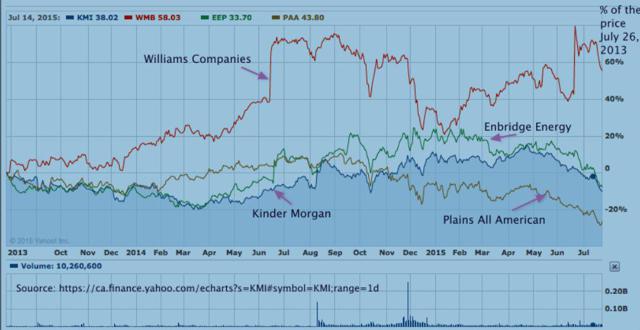
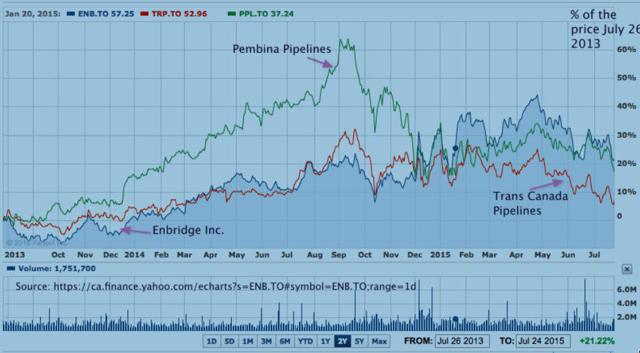
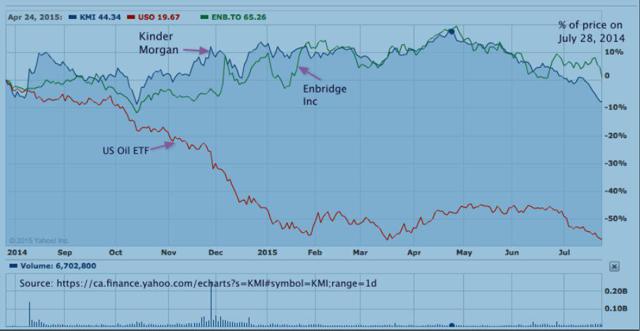
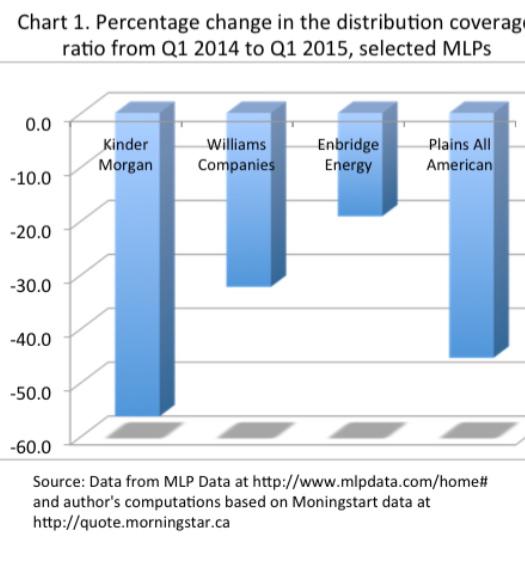
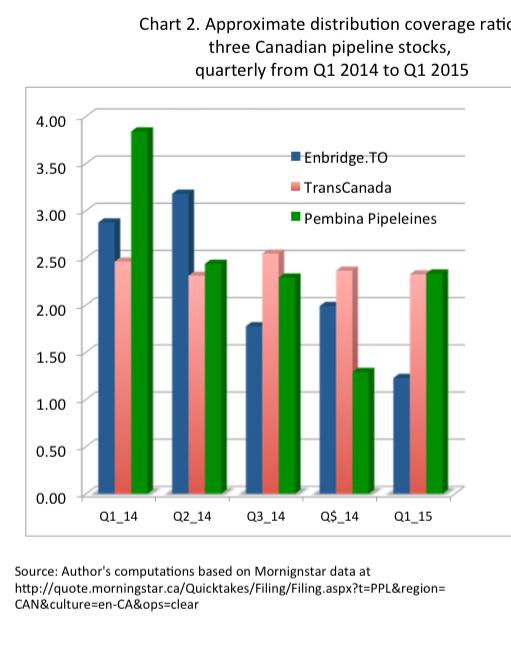
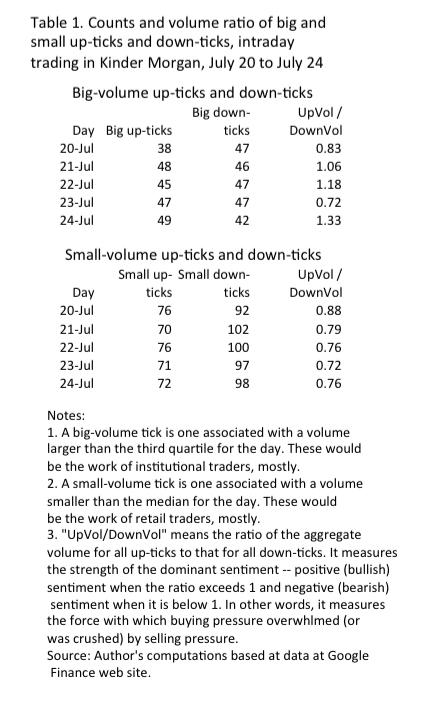
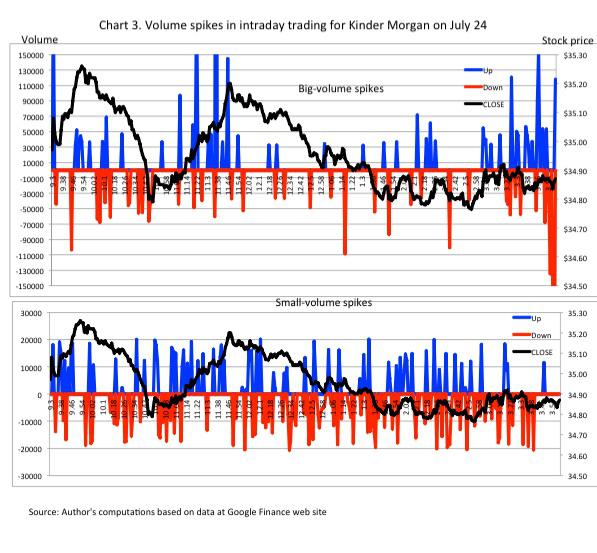 Summary The current price weakness in the energy pipeline sector offers a time window to search for good buying opportunities in the weeks ahead. Those opportunities will come, according to expert analyses of infrastructure shortages in the sector, especially in Canada. Among leading companies, distribution coverage ratios have tended to fall markedly since early 2014. Investor sentiment in the sector seems net negative but not gloomy, based on study of intraday trading. With great rhetorical flair, Zacks Equity Research recently sent Enbridge Inc. (NYSE: ENB ) into the dog house with its dreaded “Zacks Rank #5 ( Strong Sell )” rating. The next two charts show you that some leading North American pipeline stocks have joined Enbridge Inc. since May. The whole pipeline sector seems to be ‘under water’ regarding investor sentiment. In this piece, I argue that if broad market sentiment continues to deteriorate over the months ahead these pipeline stocks may not remain ugly ducklings. This is not to say that you should give them priority in any search for substantial capital gains. Rather, they may become a part of your valued shelter from the storm, even in the much anticipated rising interest rate environment. . Some will argue that their capital locked up in pipeline stocks has already been devastated. Welcome to the club! However, I would argue that many persons face a big issue here only when they are required to sell the stocks because of developments in their personal or family lives, or because some truly superior alternative investments emerge. Some key pipeline stocks have already ‘gone south big time’ The next chart, courtesy of Yahoo Finance’s great web site, shows that the stock prices of three major pipeline firms have ‘gone south’ substantially (by 10% or more) since their levels of summer 2013. However, we do not have a continuous decline since then. Plains All American (NYSE: PAA ) began a sustained a downtrend last summer, and the downward turning points for Enbridge Energy (NYSE: EEP ) and Kinder Morgan (NYSE: KMI ) were in February and May respectively. The exception to the patterns just cited, Williams Companies (NYSE: WMB ) merits a special comment, which I will offer at the end of this text. Its divergent price curve conveys a notable message. ( Compared to the selected American pipeline stocks in the chart above, the three leading Canadian pipeline stocks (ENB, TRP, PPL) are at prices still above their levels of July 2013. (See the chart below.) However, all three have had major downturns in recent months. The trend break that all three show in October may reflect their association with Canadian tar sands oil extraction businesses. Only Enbridge Inc. managed a substantial recovery from that price setback in October, and since May it has decisively joined Trans Canada Pipelines in the dog house, at least when you compare the late July prices to the early May prices. The two preceding charts suggest that money has been flowing out of the American and Canadian pipeline stocks in a big way since May. I would not argue with those who have decided that they have better places to put their cash. However, before joining them, the following question needs to be addressed. If the whole market is headed into stormy waters over the coming weeks, where exactly is the better place to put the cash that I myself might take out of the pipelines? To see why this question merits thought, look at the next chart. It allows you to compare the price patterns of United Sates Oil ETF (NYSEARCA: USO ), Enbridge Inc. , and Kinder Morgan , all expressed as percentages of their values at the end of July 2014. We all know what has happened to crude oil prices, and so the curve for USO merits little comment. What is striking here is how robustly these two pipeline stock price curves have resisted the downdraft coming from crude oil prices. One message from this chart is that if we retail traders want to benefit from investment in the oil sector, the energy transport infrastructure companies merit consideration, despite being boring with regard to prospective capital gains. As one commentator to another Seeking Alpha article asked: “after these companies finish building pipelines what do they do to create growth?” Yes they are boring; but hold on before you turn your backs on them, as the chart above suggests. Moreover, we don’t need this chart to build a case in support of the proposition that if markets become chaotic in the months ahead, some of these ugly ducklings might start to look like beauty queens. I will now give the outlines of that case. The outlook for oil pipeline and related investments In both Canada and United States, shortage of transportation infrastructure needed to help energy products to get to markets is widely reported by very knowledgeable sources. A recent GAO report states: “oil and natural gas production in the United States is outpacing the capacity to transport the resources through existing pipeline infrastructure”. A recent article in Canada’s Business Financial Post states: “Canadian natural gas producers are losing more ground to U.S. competitors as an acute shortage of pipeline space forces them to cap output.” More generally, I’ve seen some reports that shortage of transportation infrastructure is becoming a big issue for the Canadian energy sector. You have no doubt seen various stories about the expanded use of rail transport to move crude oil; but there are authoritative analyses which conclude that expansion is needed in both modes of moving energy products. A recent report prepared by IHS Global Inc . for the American Petroleum Institute concludes that “Pipelines and related investments will remain the primary mover” in the unfolding energy infrastructure business. The aggregate size of investments needed to correct the said infrastructure shortages is very large. Projections prepared by IHS Global and by Ingas Org. point to expenditures in multiple billions of dollars . The oil price downturn will have a dampening effect on the eventual size of the expenditures; but national security reasons alone tell you that these investments will be made. Yes, regulatory and other hurdles suggest that forward movement will be deliberate instead of rapid. What we should expect, according to the literature, is a great intensification of efforts to achieve important innovations concerning safety and environmental protection in the production and transport of energy products. What companies are most deserving of our investment support? However, it seems that due diligence and good luck in selecting where to hold one’s investment in this sector have become very important. Which are the strongest companies in the sector at this time? Good answers to this question seem to require in-depth study that includes (1) financial analysis, (2) tests to sense which companies have unusual sensitivity to spill-over effects of crude oil price variations, and (3) well grounded speculation about the likely impacts of potential future turmoil in energy supply, storage and demand. You can get good help with your due diligence from several articles that are on the internet, including at least two in Seeking Alpha . General principles and procedures for evaluating the relative strengths of companies in this field have been published by Standard & Poor’s Rating Services , Market Realist (click here and also here ), Seeking Alpha (click here and also here ), and Early to Rise . Many comparative analyses of specific energy-related MLPs are on the internet. Examples include this one at the Yahoo Finance web site, and this one published by Market Realist . Zacks Equity Research has highlighted three MLPs that it expects to weather the currently low prices in crude oil and natural gas. Whether specific MLPs will be able to maintain their current distribution levels has been addressed in a number of articles. Issues have been raised concerning two of the companies covered in Chart 1. See this piece by Brian Nelson , this one by Roger Conrad , as well as this in StreetInsider . If you would prefer to buy into a fund, so as to avoid the extreme volatility that may come from owning individual stocks, Tortoise Capital Advisors L.L.C. (based in Kansas and managing 18 billion dollars for clients as of June 2015) has two funds whose holdings comprise MLPs in the energy infrastructure businesses: Tortoise MLP Fund Inc. , and Tortoise North American Pipeline Fund ETF (NYSEARCA: TPYP ). Thus, there is no shortage of guidance in the literature for those who want to do their homework to achieve careful stock selection when they judge that the time is right to take long positions in the sector. If you are already in the sector and are contemplating where to reallocate your investments, the sources cited above are also helpful. I offer two very small contributions. Chart 1 below highlights the 2014 to 2015 fall in the distribution coverage ratio (a key evaluation metric) among selected USA companies (Master Limited Partnerships, a.k.a MLPs) that are involved in transporting a wide variety of energy products. These companies are in contrast to those that concentrate on particular types of energy product transportation, such as those focusing on natural gas transport. Data for the three leading Canadian oil pipeline companies are not well publicized in the USA, and Chart 2 below shows their patterns on a ratio that is very similar to the distribution coverage ratio used for evaluating MLPs in the USA. These companies may be of special interest because the national grid for oil and gas transport is heavily dependent upon them. The distribution coverage ratio is the ratio of distributable cash flow per shareholder unit (roughly analogous to a common share) to distributions (analogous to dividends) per unit. Among the set of about half-dozen metrics or evaluation criteria that one encounters in the guidance literature cited above, this ratio gets much attention. The more the distributable cash flow exceeds distributions (the more the distribution coverage ratio exceeds 1), the more confident we can feel about the capacity of the company to maintain the distribution at its current level, holding constant other factors such as management competence. Chart 1 compares two distribution coverage ratios for each MLP, focusing on the first quarters of 2015 and 2014, and does so via percentage change. Chart 1 shows marked falls in the distribution coverage ratio going from 2014 to 2015. It appears that although these companies’ revenues are not as sensitive to crude oil prices as happens with the oil production firms, activity carried out by the latter has a multiplier effect on the business generated for infrastructure companies. Turning to the three leading Canadian energy transport companies, at least for long-distance transportation, we have regular dividend-paying corporations and not MLPs. To produce Chart 2, I computed a ratio that is analogous to the distribution coverage ratio cited above. It is the ratio of an approximation of distributable cash flow to dividends. For the former, I start with net income, add back the depreciation, and then subtract “other income/loss” (which seems like a non-cash line in the income statement). I will refer to the “dividend coverage ratio” when speaking of the ratio just defined. In Chart 2, which covers Enbridge, Inc. , Trans Canada Pipelines (NYSE: TRP ), and Pembina Pipelines (NYSE: PPL ), we see strong dividend coverage ratios for the first quarter of 2014. However for two of these companies, TransCanada pipeline being the exception, there is a pronounced deterioration of the ratios following Q1 2014, with Enbridge showing the downturn in a marked degree. It has been reported in the media that a recent major corporate spin-off by Enbridge has been designed to allow the company to comfortably maintain current dividend levels. A measure of investor sentiment in the energy pipeline sector Finally, what’s the depth of the gloom in investor sentiment concerning these leading companies in the pipeline sector? It is useful to address this question, even if doing so requires that we delve into technical analysis; because the answer affects the formulation of trading strategy. For example, if a widely followed opinion leader puts a pipeline stock on its “Strong Sell” list, it is helpful to study the pattern of trading in the market to see the potential extent of the consequences and particularly to sense when the subsequent selling wave begins to abate. The arrival of abatement could be a good buying opportunity for the reasons cited above. Below I show a table and a chart drawn from a statistical analysis of intraday trading over the week of July 20 to July 24 in Kinder Morgan. Table 1 shows that during this week there was, on the whole, a balance between buying and selling forces exerted by the institutional traders. The numbers of big-volume up-ticks and big-volume down-ticks are fairly similar (see the technical definitions in the notes to the table). The volume ratio (third column in the table) shows the force of buying orders and that of selling orders exchanging dominance, without one greatly overwhelming the other over a sequence of days. The story is quite different when we look at the small-volume ticks, which I associate with retail traders, primarily. All week long, the sellers maintained dominance over the buyers. To the extent that the small-volume ticks arise from the activities of a large number of traders, and the big-volume ticks arise from those of a comparatively small number of institutional participants, we might say that there was net negative sentiment across the days in the trading of Kinder Morgan that week. However, there is no sense in which the buyers have ‘taken off and gone into the hills’ thus far. That they have not yet been crushed is suggested by Chart 3, which reviews the gory details of minute-to-minute up-tics and down-ticks along with their associated volumes on Friday, July 24 (trading in Kinder Morgan). Among the institutional traders (top section of the chart), buyers whipped sellers in the first half an hour, and again in a 45-minute period preceding noon. In the closing half an hour when volume was very heavy, buyers held sellers to a draw, except at the very close when the usual monster block of Market-on-Close orders comes in. Looking at the chart for the retail traders, we see a seesaw battle between the buying and selling forces most of the day up to 3PM. In short, we see the usual tug of war between buying and selling forces, with a slight edge in favor of the latter. Closing comments Just before the closing comment, I wish to return to the curve for Williams Companies in the first chart above, the one derived from Yahoo Finance. Many of us know that the huge price jump that it shows in February was firmly linked to an impressive takeover offer that management rejected. Since then, the stock price has remained remarkably buoyant, turning down substantially only in recent weeks. This means that investor sentiment is still being influenced strongly by the promise a future takeover involving Williams Companies, I think. In closing, I have suggested that the current price weakness in the energy pipeline sector offers a time window within which to do due diligence and other homework toward the day when good buying opportunities will seem to arrive. That day will come, according to expert analyses of infrastructure shortages in the sector, especially in Canada. Those of us who accept this viewpoint must confront two key challenges, however. The first is to achieve good stock selection (that is, to be effective in avoiding the eventual ‘weak sisters’). The second is to identify the stocks’ price-wave boundaries in real time. The latter seems to require a combination of technical analysis knowledge and skill, as well as keeping a sharp eye on swings in trader sentiment for the whole market as well as for the pipeline sector. The last comment points to a timing problem. Some would argue that given the pressing need for the described infrastructure expansions and associated technological advances, investors may be best advised to simply buy, hold, and be very patient; thus leaving the said timing issue to those who insist on trying to be nimble traders. ‘Buy and hold’ makes sense to me here, although one still needs constant vigilance concerning management competence and damaging Black Swans (bad luck) affecting the stocks of the companies we own either directly or through a fund. Disclosure and disclaimer. I am long ENB and thinking of getting more deeply into the sector. I am not a licensed investment advisor, and what you read above is descriptive and theoretical commentary that is not designed to be investment advice. My hope is to contribute to your empowerment in going about your own research. Disclosure: I am/we are long ENB. (More…) I wrote this article myself, and it expresses my own opinions. I am not receiving compensation for it (other than from Seeking Alpha). I have no business relationship with any company whose stock is mentioned in this article. Scalper1 News
Scalper1 News