Tag Archives: yield

Duke Energy – Lofty Valuations, Deteriorating Fundamentals

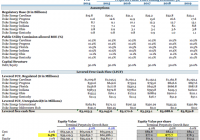
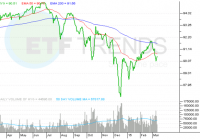
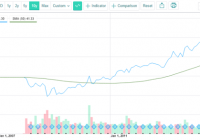
Summary Duke Energy is a high quality large cap regulated utility. Duke Energy’s cost of equity, estimated to be 6.50%, does not properly compensate its shareholders. Duke Energy’s risk-reward is not attractive from the long-perspective. Executive Summary: Duke Energy (NYSE: DUK ) is a high-quality large-cap regulated utility , headquartered in North Carolina, with international assets located in Latin America. However, Duke Energy’s cost of equity at 6.5% is cheaper than the cost of preferred shares at 7.1% and is marginally more expensive than its cost of debt at 5.1%. Therefore, Duke Energy does not properly compensate its shareholders and Duke Energy’s risk-reward is not attractive from the long perspective. Duke Energy Short Thesis: Duke Energy is a regulated electric utility . The company, to a lesser extent, is a merchant power provider. The company is engaged in the generation, transmission, and distribution of electricity. The company’s energy generation portfolio consists of a wide variety of sources such as nuclear, coal, natural gas, solar, wind and hydroelectric. The company’s geographic footprint includes the Carolinas, Indiana, Florida, Ohio and Kentucky. The company also has non-core unregulated assets in Latin America, primarily located in Brazil, that accounted for ~13.0% of the company’s FYE 2014 sales. The company also has a small joint venture located in Saudi Arabia. However, Duke Energy’s risk-reward profile is not attractive from the long perspective. Currently, the company’s cost of equity of 6.5% does not properly compensate the company’s shareholders. Duke Energy’s preferred shares, which are higher on the company’s capital structure, yield 7.1%. Furthermore, Duke Energy’s shareholders currently faces an inordinate amount of risk given the penetration of distributed generation, also known as residential rooftop solar, the deterioration of Duke Energy’s international assets and the mismanagement of Duke Energy’s coal ash spill. Firstly, Duke Energy’s cost of equity of 6.5% does not properly compensate Duke Energy’s shareholders. Duke Energy’s implied cost of equity capital could be easily backed into given that Duke Energy is a regulated utility with earnings “fixed” by its regulators. Duke Energy’s regulatory rate base is $51.0 billion, broken down into $19.8 billion in Duke Energy Carolinas, $11.6 billion in Duke Energy Progress, $8.7 billion in Duke Energy Florida, $7.3 billion in Duke Energy Indiana, $2.3 billion in Duke Energy Ohio, and $0.8 billion in Duke Energy Kentucky. Duke Energy’s projected increases to its regulatory rate base are provided on Duke’s earnings call presentation and provided below. The Public Utility Commission allowed ROE, on Duke’s regulatory rate base, is 10.2% for Duke Energy Carolinas and Duke Energy Progress, 10.5% for Duke Energy Florida and Indiana, 11.1% for Duke Energy Ohio and 10.4% for Duke Energy Kentucky. Normalizing Duke Energy’s capital structure at 50% debt to equity (currently 47.1% debt to 52.9% equity) and normalizing Duke Energy’s international earnings to 10% of the company’s earnings, Duke Energy’s implied cost of equity is 6.5% with shares at $77.70. Sensitivity analysis would suggest that Duke Energy’s cost of equity is between 6.0% and 7.0% with a high degree of confidence. (click to enlarge) Source: Author Duke Energy’s current return on equity of 6.5% is extremely difficult to justify given that Duke Energy’s bonds yield a similar percentage point and given that Duke Energy’s equity is considerably riskier than its debt. Duke Energy’s junior subordinated debentures issued in 2013 due in 2073 currently yield 5.125% (see, below). Duke Energy’s junior subordinated debt is rated BBB- by Fitch. (click to enlarge) Source: Duke Energy Duke Energy’s current return on equity of 6.5% is extremely difficult to justify given that Duke Energy’s preferred shares, now called, yield a higher percentage point and given that Duke Energy’s equity is considerably riskier than its preferred shares. Duke Energy’s (Florida Progress) preferred shares, recently called, yielded 7.10%. (click to enlarge) Source: Duke Energy Prospectus Simply put, Duke Energy’s cost of equity or return on equity from the shareholders perspective at 6.5% is too little to wet the beak of investors. Duke Energy’s junior debt and preferred shares yield 5.125% and 7.100% respectively. Therefore, Duke Energy’s cost of equity should, at a minimum, be greater than 7.100%. Currently, Duke’s most subordinated debt is rated BBB- by Fitch. Therefore, Duke Energy’s return on its equity, which is subject higher risk than Duke Energy’s debt should Duke Energy experience financial turbulence, should be on par with the return on more subordinated debt, such as the CCC rated bonds, which are currently yielding 10.53% (see, below). (click to enlarge) Source: WSJ Market Data Center Duke Energy’s return on equity is too low. Should Duke Energy’s cost of equity become equivalent to the yield of its previously issued preferred shares, Duke Energy’s shares would be worth, at a maximum, $72.0 (6.0% upside from current prices at $76.0). Should Duke Energy’s cost of equity become equivalent to that of CCC-rated debt, Duke Energy’s shares would be worth $49.0 (38% upside from current prices at $76.0). The likely scenario would be that Duke Energy’s cost of equity would fall somewhere in between the yield of its preferred shares and the yield of a CCC-rated debt, which would suggest that Duke’s shares are worth between $55 to $62 (~25% upside from current prices at $76.0). Calculations are provided below. (click to enlarge) Source: Author Secondly, Duke Energy will struggle to deliver its meager 6.5% ROE as a distributed generation, also known as residential solar, eats into Duke Energy’s revenues and earnings. Currently Duke Energy charges 10.979 cents per KWh for the first 1,000 KWh of electricity delivered, broken down into a 6.656 cents energy charge and 4.323 cents fuel charge, and charges 13.341 cents per KWh for every KWh above 1,000 KWh, broken down into a 8.018 cents energy charge and 5.323 cents fuel charge. (click to enlarge) Source: Duke Energy Residential rooftop solar companies can deliver energy at increasingly competitive price points. SolarCity can deliver electricity at 15.000 cents per KWh (versus Duke Energy at 10.979 cents to 13.341 cents per KWh). Duke Energy’s price per KWh will increase, while SolarCity’s price per KWh will decrease. As Duke Energy increases its regulatory rate base, which includes investments in generation, transmission, and distribution infrastructure, the Company will recover these costs by increasing its price per KWh. On the other side of the coin, as solar technology becomes more efficient, solar companies will be able to decrease the price per KWh. According to GTM , the levelized cost of solar has decreased by 78% over the past 5 years and is expected to further decline. Please note that SolarCity was utilized for pricing purposes only as PPA/leases are not allowed in the state of North Carolina. (click to enlarge) Source: SolarCity Thirdly, Duke Energy will struggle to deliver its meager 6.5% ROE as the Company’s international operations further deteriorate . The company’s international assets, primarily located in Brazil, has suffered from FX exchange rate losses as the Brazilian real slumped against the US dollar. Furthermore, Duke Energy’s assets in Brazil primarily consist of hydroelectric plants. Due to a prolonged drought, thermal generation, such as coal and nuclear plants, are put ahead of hydrogen plants. This means that Duke Energy cannot run its hydroelectric plants and sell electricity until thermal plants are at full generation capacity. Furthermore, due to Brazil’s electricity conservation efforts, the growth of the demand of electricity slowed from a growth rate of 3.0% a year to a growth rate of 0.0% to 2.0% a year. Furthermore, the price of electricity has slumped in Brazil from 823 Brazilian reals per MWh to 388 Brazilian reals per MWh. Fourthly, Duke Energy will struggle to deliver its meager 6.5% ROE as the Company, which violated the Clean Water Act, faces large litigation issues. On 02/14/2014, one of the company’s water main failed , which resulted in a large coal ash spill into the Dan River. This accident resulted in $102.2 million of restitution costs. Furthermore, the company could be on the hook for an additional $25.1 million in restitution costs for its involvement in the groundwater contamination in Wilmington, NC. In Closing, Duke Energy presents an excellent short opportunity. The risk/reward from the long perspective is not compelling. The company’s return on equity is 6.5%, which is less than the return on the company’s preferred shares. The company faces an inordinate amount of risk, given the company’s potential risk with distributed generation, potential risk with the further deterioration of the company’s international assets, and potential risk with further litigation of the company’s coal-ash spills. Disclosure: The author has no positions in any stocks mentioned, and no plans to initiate any positions within the next 72 hours. (More…) The author wrote this article themselves, and it expresses their own opinions. The author is not receiving compensation for it (other than from Seeking Alpha). The author has no business relationship with any company whose stock is mentioned in this article.

Investors Grow Wary Of High-Yield, Junk Bond ETFs

Summary ETF investors are pulling out of high-yield, junk bonds. Rising junk bond issuance may be pressuring high-yield market. However, some bond investors may be turning to low-duration junk bond ETFs to hedge rate risks. After staging a decent rally this year, high-yield speculative-grade bond exchange traded funds are now experiencing large withdrawals. Retail investors pulled $1.96 billion from U.S. high-yield funds for the week ended March 11, with 97% of the total, or $1.91 billion from ETFs, writes Matthew Fuller of S&P Capital IQ on Forbes . Over the week ended March 11, the iShares iBoxx $ High Yield Corporate Bond ETF (NYSEArca: HYG ) experienced $1.5 billion in outflows and the SPDR Barclays High Yield Bond ETF (NYSEArca: JNK ) saw $921.6 million in redemptions, according to ETF.com . The large withdrawals and pullback in high-yield bonds may be in response to the sudden influx of $11 billion in speculative-grade debt to hit the market, the biggest sale of securities in almost a year and 26% ahead of last year’s supply, Bloomberg reports. Over the past week, HYG dipped 0.8% and JNK fell 0.5%. “The market is showing some indigestion,” John McClain, a money manager at Diamond Hill Capital Management Inc., said in the Bloomberg article. “It’s harder to find value with a lot of companies taking a ‘now or never’ approach to the market, pouring a lot of supply into the market.” Additionally, short-duration junk bond options also experienced modest inflows, which suggests that some investors may be hedging against potential rate risks ahead. For instance, the SPDR Barclays Short Term High Yield Bond ETF (NYSEArca: SJNK ) , which has a 2.28 year duration, attracted $96.5 million in assets for the week ended March 11 while the iShares 0-5 Year High Yield Corporate Bond ETF (NYSEArca: SHYG ) , which has a 2.26 year duration, added $4.9 million in assets. In contrast, HYG has a 4.03 year duration and JNK has a 4.22 year duration – duration is a measure of a bond fund’s sensitivity to changes interest rates, so a lower duration corresponds with a smaller sensitivity. iShares iBoxx $ High Yield Corporate Bond ETF (click to enlarge) Max Chen contributed to this article . Disclosure: The author is long HYG, JNK. (More…) The author wrote this article themselves, and it expresses their own opinions. The author is not receiving compensation for it. The author has no business relationship with any company whose stock is mentioned in this article.

20% Dividend Raise And Recent Pullback Make My Favorite Utility Northwestern Corp. Attractive

NWE raised its dividend 20% for Q1 2015 to $0.48 per common share (3.67% annually). Q4 2014 adjusted earnings were $2.68 per share (at the midpoint of guidance of $2.60-$2.75) a +7.2% improvement over Q4 2013. Total revenues were about $312.95 million. This was a miss of -$37.14 million. Revenues were down year over year about -1.9%. Northwestern Corp. (NYSE: NWE ) does business under the name Northwestern Energy. On February 15, 2002 Northwestern Corp. acquired the energy distribution and transmission business of Montana Power to form Northwestern Energy (still Northwestern Corp. though). It is a leading energy delivery company with business in Montana, South Dakota, Nebraska, and Wyoming, especially the first two states. It recently raised its dividend by 20% to $0.48 per common share per quarter for a 3.67% annual yield. The long term chart of NWE below shows it to be in a strong upward trend long term. (click to enlarge) Essentially NWE has gone straight upward since the low of the Great Recession. Perhaps as significantly, it had recovered fully from the Great Recession by April 1, 2010. Such stalwarts as Chevron and Johnson & Johnson took much longer — until early 2011 and late 2012 respectively. Even stalwart utility companies such as Southern Company (NYSE: SO ) and Consolidated Edison (NYSE: ED ) took until early 2011 to recover to their 2007 highs. NWE has a past as an outperformer; and its future will likely be equally as bright. To understand the latest stock price movements, it may be best to look at the charts of the 10 year US Treasury Note yield and the one year chart of NWE . (click to enlarge) The yellow line in the NWE chart above demarks January 30, 2015, which was the recent yield nadir for the 10 year US Treasury Note. As the yield for the 10 year US Treasury Note rose from 1.64% on January 30, 2015 to 2.24% on March 6, 2015, the price of NWE stock fell. This is the normal scenario for utilities when interest rates rise because the utilities’ dividend rates are normally remaining unchanged. This high correlation also likely tells investors that this is a good time to buy NWE (and utilities in general), if you believe the yield on the 10 year US Treasury Note is resuming its downtrend. There are many reasons to believe this: Most EU bonds have been trending downward due to the €1.1 trillion ECB QE program in 2015. Many bonds that are generally viewed as riskier and less stable than US Treasuries currently have much lower yields (and are much more expensive) than US Treasuries. For example, the Spanish 10 year bond yield is 1.15% and the Italian 10 year bond yield is 1.13% . These low yields on “riskier” bonds should push the yields of the “less risky” 10 year US Treasury bonds downward. The 10 year US Treasury Note yield is 2.12% as of this writing March 13, 2015. The USD has risen dramatically against the Euro and other currencies in the last year. For instance, the Euro has fallen from 1.39 USD per Euro on May 6, 2014 to 1.06 USD per Euro as of the close on March 12, 2015 (almost a -24% drop). If the USD is appreciating against other currencies, that makes US Treasuries that much more attractive to foreign investors. After all a European could have made fantastic money just on the appreciation of the USD since May 6, 2014, if the European had owned US Treasuries. He/she would also have gotten the yield on the Treasuries. Plus since US Treasury yields have been going down, the European investor would have gotten appreciation on the price of the US Treasuries. Since many people think the devaluation of the Euro versus the USD is likely to continue as the ECB dispenses more QE in 2015, many Europeans seem likely to invest in US Treasuries. This should act to increase the prices (decrease the yields) of US Treasuries. That in turn is also motivation for investors (including Europeans and Japanese) to buy US utility stocks, which will likely have stable to increasing yields. All of the major economies other than the US have been increasing easing actions. The BOJ has a huge QE program . The PBOC has recently been announcing new easing programs . If there is a lot of extra liquidity around, people will not want to pay very much in interest rates to borrow money. Foreign investors will also be happy to keep their money in Treasuries of the one country with an appreciating currency (the one that is not doing more easing currently). The US Fed has talked about raising its rates, especially the Fed Funds rate. If it did this, that would likely lead to higher US Treasuries yields. However, this is increasingly unlikely. The US inflation rate was -0.1% in January 2015; and the overall trend has been strongly downward in recent months. If the US Fed tries to raise rates in that environment, it will only cause STAGFLATION. Further a raise in rates would cause the USD to appreciate that much faster; and the appreciation we have seen just since May 6, 2015 is already hurting US exports. It is also spurring foreign imports. Both of these items will tend to act to destroy US jobs, although there may be a lag in the effect. This would act directly against the Fed’s mandate on full employment. Plus it clearly doesn’t need to control inflation through a rate increase at this time, which is the Fed’s main mandate. On top of all of the above, NWE is a well run company that has seen steady growth. Adjusted EPS for Q4 2014 were $2.68 per common share (a +7.2% improvement over Q4 2013). For FY2014 GAAP Net Income was $120.7 million (or $2.99 per diluted share) compared to $94.0 million of $2.46 per diluted share for FY2013 — a 22% improvement. GAAP Net Income guidance for FY2015 is for $3.10-$3.30 per diluted share — a midpoint 7% improvement. This is good growth for a utility. A key factor in NWE’s growth will be the new Hydro facilities purchased from PPL Montana in late 2014. These are eleven hydroelectric generating facilities ( 633 Megawatts ). They were obtained for $900 million. $870 million of that purchase price was added to the rate base with a 50-year life. Return on equity is expected to be 9.8%. The capital structure is 52% debt and 48% equity. This resulted in $400 million in issued equity (7.767 million shares issued at $51.50 per share) and $450 in new debt. The resulting first year annual retail revenue requirement is approximately $117 million. The debt is 30-year first mortgage bonds with a coupon of 4.176%. The all-in cost of the debt was 4.353%. Of this 4.25% is recoverable under the hydro approval granted by the Montana PSC. The transaction closed November 18, 2014. This should be a good new revenue source for FY2015. It should help NWE meet or exceed its guidance. The chart below shows NWE’s recent history of meeting or exceeding its guidance. (click to enlarge) As investors can see, there is a high likelihood that NWE will beat its initial FY2015 guidance. Any upward revisions during the year should help the stock rise. With a 3.67% dividend and an uptrend in the stock price that is almost unshakeable, NWE appears to be about as much of a sure thing as investors can find. When you add the quick recovery it showed from the Great Recession, it makes it even more attractive in a very uncertain market. We have already had six plus years of the current bull market. A bear market may be on the near horizon. If so, NWE may be a relatively good place to be. It will pay you a nice dividend to wait for a recovery in any stock price fall. Another point in NWE’s favor is that Fitch upgraded NWE’s Issuer Default Rating to BBB+ on November 5, 2014. Fitch gave as reasons: The acquisition of the hydroelectric portfolio. The low risk, regulated utility business model. The improved financial and business profile. Its moderating CapEx budget. From a metrics standpoint, the PE of 17.49 and the FPE of 15.34 indicate a currently reasonable price of $52.30 per share as of the close March 12, 2015. The average analysts’ one year price target is only $57.46 per share, but this could easily rise significantly if the new hydro facilities provide a bit more income than has likely been conservatively estimated. The Beta of 0.52 is also a positive in an uncertain market. NWE is a buy with an average analysts’ next five years EPS growth per annum forecast of 7.60%. This is outperformance in the utility industry. The comparable numbers for a few other major utilities are: Consolidated Edison — 2.77% EPS growth, Southern Company — 3.30% EPS growth, and Duke Energy (NYSE: DUK ) — 4.52% EPS growth. There has been no insider selling on NWE. NOTE: Some of the fundamental fiscal data above is from Yahoo Finance. Good Luck Trading/Investing. Disclosure: The author has no positions in any stocks mentioned, but may initiate a long position in NWE over the next 72 hours. (More…) The author wrote this article themselves, and it expresses their own opinions. The author is not receiving compensation for it (other than from Seeking Alpha). The author has no business relationship with any company whose stock is mentioned in this article.