Tag Archives: vnq

Momentum Model Of ‘Swensen Six’ Portfolio Recommends 100% In Cash

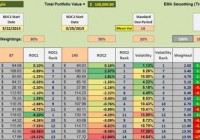
Momentum Model called for move to cash back on August 10th. A three metric model is used to drive the momentum model. The “Swensen Six” portfolio covers six asset classes, depending on how asset class is defined. Example ETFs are provided to populate the recommended asset classes. David Swensen, in his book, Unconventional Success: A Fundamental Approach to Personal Investment , lays out what he calls “The Science of Portfolio Structure.” The following bullet points lay out the basic points of Swensen’s logic for constructing what I call the “Swensen Six” portfolio. Basic financial principles require the portfolio exhibit diversification and equity orientation. The “Swensen Six” is well diversified in that it covers the globe by using U.S. Equities (NYSEARCA: VTI ), Developed International Equities (NYSEARCA: VEA ), and Emerging Market Equities (NYSEARCA: VWO ). By equity orientation Swensen skews a portfolio toward stocks instead of bonds. The equity Exchange Traded Funds (ETFs) in the “Swensen Six” are: VTI, VEA, VWO, and VNQ . High expected return types of securities dominate the portfolio as 70% is allocated to equity investments. The specific percentages are listed below. Use six asset classes to provide portfolio diversification. Domestic equities comprise 30% of the portfolio or invest 30% in VTI. Swensen is not specific about the individual securities so I am recommending particular ETFs for each asset class. The percentages are Swensen recommendations. Determining what percentage to invest in what asset class is one of the most difficult decisions individual investors face when it comes to portfolio construction so Swensen’s percentage recommendations are most helpful. Developed international equities carry a recommendation of 10% so invest 10% in VEA. Originally, Swensen recommended 15% be allocated to developed international equities, but in a more recent paper lowered the percentage to 10%. One could stay with the original 15% recommendation. Emerging markets make up 10% of the portfolio so invest 10% in VWO. Originally, Swensen recommended 5% be assigned to emerging markets, but he later shifted 5% from developed international equities to emerging markets. One could stay with the original 5% recommendation. Domestic Real Estate makes up 20% of the total portfolio so invest 20% in VNQ. Another option is to invest 15% in VNQ and 5% in RWX , an international REIT ETF. This is my preference as it adds more diversification by adding a seventh asset class, International Real Estate. Investors wishing to keep life simple will stick to the “Swensen Six” rather than expand to include RWX. U.S. Treasury Bonds make up another 15% of the portfolio so invest 15% of the total in TLT . U.S. Treasury Inflation-Protected Securities is the last asset class and we invest 15% in TIP . In my Dashboards worksheet, I classify both TLT and TIP in the Bonds and Income asset class, but for purposes of following Swensen, I’ll break the two into separate asset classes. With only six ETFs, Swensen covers the globe so diversification is accomplished. The equity orientation is in place as 70% of the portfolio is tilted in that direction. Swensen provides interesting logic behind his recommendations. Two paragraphs from page 83 of his book state it very well so I quote below: “Investors achieve equity orientation by investing a preponderance of assets in the high-expected-return asset classes of domestic equity, foreign developed equity, emerging market equity, and real estate. The return-generating power of equity positions drives the results of long-term investment portfolios. Investors give up expected return to defend portfolios against unanticipated inflationary or deflationary economic conditions. U.S. Treasury Inflation-Protected Securities protect against inflation with certainty, while real estate holding guard against inflation with reasonable assurance. In the long run domestic equities add to the inflation-hedging characteristics of a portfolio, but in the short run domestic equities prove notoriously unreliable as inflation hedges.” This six ETF portfolio has an equity emphasis, provides some protection against inflation and is broadly diversified. By keeping these six assets in balance, the passive investor is well served. If you are a momentum style investor, what does the “Swensen Six” look like in the current market environment? Below is the ranking for these six ETFs and as readers can see, all monies are investing in SHY or cash. None of the critical ETFs are ranked above SHY. ETF Rankings of “Swensen Six”: The following ranking is built upon three metrics. Fifty percent (50%) of the weight is allocated to the performance of each ETF over the past 91 calendar days. Thirty percent (30%) of the weight is assigned to the performance over the most recent 182 calendar days and the final 20% is a volatility measurement where low volatility is highly valued. SHY is the cutoff or “circuit breaker” ETF. When the ETFs rank below SHY, as is currently the case, 100% of the portfolio is invested in SHY or cash. The portfolio is reviewed every 33 days as the ETFs are ranked again to see if any show up for potential investment. This portfolio has been in cash for nearly two months. (click to enlarge)

Ivy Portfolio September Update

The Ivy Portfolio spreadsheet tracks the 10-month moving average signals for two portfolios listed in Mebane Faber’s book The Ivy Portfolio: How to Invest Like the Top Endowments and Avoid Bear Markets . Faber discusses 5, 10, and 20 security portfolios that have trading signals based on long-term moving averages. The Ivy Portfolio spreadsheet tracks both the 5 and 10 ETF Portfolios listed in Faber’s book. When a security is trading below its 10-month simple moving average, the position is listed as “Cash.” When the security is trading above its 10-month simple moving average, the position is listed as “Invested.” The spreadsheet’s signals update once daily (typically in the late evening) using dividend/split adjusted closing price from Yahoo Finance. The 10-month simple moving average is based on the most recent 10 months including the current month’s most recent daily closing price. Even though the signals update daily, it is not an endorsement to check signals daily or trade based on daily updates. It simply gives the spreadsheet more versatility for users to check at his or her leisure. The page also displays the percentage each ETF within the Ivy 10 and Ivy 5 Portfolio is above or below the current 10-month simple moving average, using both adjusted and unadjusted data. If an ETF has paid a dividend or split within the past 10 months, then when comparing the adjusted/unadjusted data you will see differences in the percent an ETF is above/below the 10-month SMA. This could also potentially impact whether an ETF is above or below its 10-month SMA. Regardless of whether you prefer the adjusted or unadjusted data, it is important to remain consistent in your approach. My preference is to use adjusted data when evaluating signals. The current signals based on August 31st’s adjusted closing prices are below. It will probably come as no surprise that this month all ETFs; the Vanguard Total Bond Market ETF (NYSEARCA: BND ), the SPDR Dow Jones International Real Estate ETF (NYSEARCA: RWX ), the Vanguard FTSE Emerging Markets ETF (NYSEARCA: VWO ), the PowerShares DB Commodity Index Tracking ETF (NYSEARCA: DBC ), the iShares S&P GSCI Commodity-Indexed Trust ETF (NYSEARCA: GSG ), the Vanguard REIT Index ETF (NYSEARCA: VNQ ), Vanguard Total Stock Market ETF (NYSEARCA: VTI ), Vanguard Small Cap ETF (NYSEARCA: VB ), Vanguard FTSE All-World ex-US ETF (NYSEARCA: VEU ), and the iShares TIPS Bond ETF (NYSEARCA: TIP ), are below their 10-month moving average. Last month 7 of the 10 were below their respective moving average. The spreadsheet also provides quarterly, half year, and yearly return data courtesy of Finviz. The return data is useful for those interested in overlaying a momentum strategy with the 10-month SMA strategy: (click to enlarge) (click to enlarge) I also provide a “Commission-Free” Ivy Portfolio spreadsheet as an added bonus. This document tracks the 10-month moving averages for four different portfolios designed for TD Ameritrade, Fidelity, Charles Schwab, and Vanguard commission-free ETF offers. Not all ETFs in each portfolio are commission free, as each broker limits the selection of commission-free ETFs and viable ETFs may not exist in each asset class. Other restrictions and limitations may apply depending on each broker. Below are the 10-month moving average signals (using adjusted price data) for the commission-free portfolios: (click to enlarge) (click to enlarge) Disclosures: None.

Momentum Model Recommends Investors Move To Cash

The momentum model currently recommends investing in SHY or a money market. This model outperforms the VTTVX benchmark. The momentum model also minimizes draw-down. Dual Momentum as well as other momentum models are receiving considerable attention as the momentum anomaly appears to have significant staying power. In the following ETF ranking table and the performance graph, this momentum model demonstrates how one can generate benchmark beating returns while lowering portfolio volatility. The following data table is made up of fourteen ETFs that provide global diversification. ETFs used in this example are also found in the Baker’s Dozen article with one addition, BIV, an intermediate bond fund. The fourteen ETFs are: VTI , VEA , VWO , VNQ , RWX , TIP , TLT , DBC , GLD , PCY , BIV , VOE , VBR , and SHY . This array of ETFs covers the U.S. Equities market, developed international equities, emerging market equities, U.S. REITs, international REITs, bonds, gold, commodities, and treasuries. VOE and VBR are included to take advantage of any value anomaly, should it exist. ETF Rankings: Driving the following rankings are three metrics. Performance over the past 87 calendar days. A 30% weight is assigned to this performance percentage. Performance over the past 145 calendar days where a 50% weight is assigned to this performance percentage. Low volatility is an advantage so a 20% weight is assigned to a mean-variance of 14 calendar days. Based on extensive back-testing and out-of-sample analysis, the above variables provided the best return/volatility ratio. An example of such testing is provided in the second screen-shot. As of 8/17/2015, this momentum model recommends investing 100% of the portfolio in SHY as there are no ETFs outperforming this 1-3 yr. treasury bond. Looking for ETFs that are outperforming SHY is an application of the absolute momentum principle where one does not invest in ETFs if they are under-performing the cutoff or circuit breaker ETF. SHY is that cutoff ETF. (click to enlarge) Performance Data: A frequent question is – how well does such a momentum oriented portfolio perform? Since one set of data or one back-test is insufficient to come to any conclusions, a Monte Carlo analysis is run on this set of ETFs. The portfolio is reviewed every 33 days. We are looking for ETFs that are ranked above SHY (none are in the current ranking) and if there are two, we invest equal amounts in those two securities. Should there be a tie, we invest equal amounts in the top three. ETFs under-performing SHY are sold out of the portfolio. The look-back periods are 87 and 145 calendar days as mentioned above. Beginning on 6/30/2006 we capture two bull markets and a severe bear market. The overall return of the portfolio managed using this momentum model is 287% while the VTTVX benchmark is 78%. Draw-downs (“DDs”) are always of interest and here again the momentum portfolio shines by limiting the maximum DD to 24.1% while the benchmark had a maximum DD of 27%. The average DD for the momentum portfolio was an acceptable 10.4%. The light colored or gray graphs show the 50 runs made for this set of ETFs operating under the stated guidelines. The dark line is the average. Even the worst performing run outperformed the benchmark. Not only does the momentum model provide protection against deep bear markets such as we experienced in 2008 and early 2009, the portfolio also shows a much steeper slope during the bull market since March of 2009. The above momentum model was not selected to generate the very best return. Instead, it was built to be a robust portfolio in all types of conditions. Using SHY as the circuit breaker is our volatility check and should keep one away from the depths of a bear market. The model does require discipline as one needs to review the portfolio every 33 days. The above graph shows the benefits of such discipline. Disclosure: I am/we are long VTI,SHY. (More…) I wrote this article myself, and it expresses my own opinions. I am not receiving compensation for it (other than from Seeking Alpha). I have no business relationship with any company whose stock is mentioned in this article. Additional disclosure: The back-test runs were performed by Ernest Stokely.