Tag Archives: underlying

AMLP Shareholders Beware

By hidden design, the ALPS Alerian MLP ETF (NYSEARCA: AMLP ) robs shareholders of 37% of their upside gains. It was the first ETF do this, and when I revealed AMLP’s dirty little secret to owners and potential buyers, many did not seem to care. “It’s all about the dividend,” they emphatically stated. “Plus, in a down market, AMLP will only fall 63% of the underlying index,” they crowed. AMLP clips 37% of performance because it is a C-corporation that is liable for federal and state taxes, estimated to be about 37% of any capital appreciation and taxable income. The supposed “benefit” of this horrendous tax drag is that it would act as a buffer during down markets, limiting declines to just 63% of those experienced by the underlying index. However, AMLP is failing to live up to those expectations. The fund has been falling like a rock the past ten weeks. Shareholders missed out on the lion’s share of gains on the upside, and now they are getting screwed again as the fund loses more than its underlying Alerian MLP Infrastructure Index. The promise of smaller losses in a down market is now history. Evidence of this can be found on AMLP’s website , where the one-month performance of the fund was -7.96% for November, while the underlying index is showing a 7.95% loss. The problem began in mid-September, so the three-month performance of -13.36% doesn’t reveal this discrepancy, yet. The performance table also shows that since inception, AMLP has had a cumulative return of +14.63%, while its index returned +34.56%. AMLP has returned less than 38% of the underlying index return. The other 57% has been eaten up by taxes and fees. Owners of AMLP are blinded by the yield. Based on its fourth-quarter distribution of $0.299 and Friday’s (12/4/15) closing price of $10.91, this C-corporation disguised as an ETF has a seductive yield of 10.96%. What many owners do not comprehend is the degree of principal being robbed in order to support the illusion of a high yield. Fortunately, the UBS ETRACS Alerian MLP Infrastructure Index ETN (NYSEARCA: MLPI ) tracks the same Alerian MLP Infrastructure Index, making it easy to see AMLP’s shortcomings. Using data and software from Investors FastTrack , I was able to produce charts making a revealing comparison. Please note that MLPI uses an exchange traded note (“ETN”) structure with its own drawbacks , but its performance helps to understand the flaws of AMLP. Here is a long-term performance graph comparing the two. AMLP is in red, MLPI is in green, and the light-blue line in the lower half shows the relative strength of AMLP to MLPI (a rising line indicates AMLP is performing better than MLPI). From AMLP’s inception on 8/25/2010 through its performance peak on 8/29/2014, it had a total cumulative return of 67.4%. During the same period, MLPI had a total cumulative return of 110.5%. During this rising market, AMLP only returned 61% of what MLPI captured. (click to enlarge) During that up market, MLPI’s price went from $26.74 to $46.22, resulting in 72.8% capital appreciation. Meanwhile, AMLP’s price went from $14.98 to $19.31, resulting in just a 28.9% capital appreciation, or only about 39.7% of what MLPI delivered. One of the unwritten promises of AMLP was that while it lagged on the upside, it would shine in down markets because its deferred tax liabilities would become assets, greatly reducing the downside impact. However, AMLP’s price fell 43.5% from 8/29/2014 through 12/4/2014, while MLPI’s price fell 48.6%. The ratio of AMLP’s price decline to MLPI’s was 89.4%-much worse than the “promised” 63% and nowhere near the 39.7% of the upside it captured. From a total return perspective, AMLP fell 43.5% to MLPI’s 48.6% decline. For the entire cycle, AMLP’s price went from $14.98 to $10.91. This principal erosion of 27.2% is the cost of supporting the 10.96% current yield. Since inception, AMLP has returned 3.8% (0.71% annualized), and MLPI has returned 15.4% (2.75% annualized). AMLP had an upside capture of 61% (39.7% based on price) and a downside capture of 89%. It won’t take too many cycles like this to completely obliterate AMLP’s principal. Zooming in reveals AMLP’s most recent problem. During falling markets, AMLP is supposed to fall much slower than MLPI. That was true from mid-May through mid-September of this year, and it can been seen in the rising light-blue relative-strength line. However, beginning around September 11, that changed. The relative-strength line went flat as AMLP plunged 19.54% between 9/11/2015 and 12/04/2015. Over this same period, MLPI dropped slightly less-19.49%. (click to enlarge) AMLP’s touted downside buffer has disappeared. Presumably because it used up all of its deferred tax liabilities/assets, exposing the more than $6 billion of shareholder assets to the full brunt of the MLP market decline. History has shown that AMLP investors don’t care. They only care about the yield. The erosion of principal helps to exaggerate the current yield while robbing long-term holders of principal. Owners who bought their shares on in 2014 at $19.31 per share do not receive the new 10.96% yield. They are getting a 6.2% yield on their initial investment, and it has cost them 43.5% of their principal. Maybe now they will start to care. Note: In early trading today (12/7/2015), AMLP plunged another 9% to a price of less than $10. Disclosure: Author has no positions in any of the securities, companies, or ETF sponsors mentioned. No income, revenue, or other compensation (either directly or indirectly) is received from, or on behalf of, any of the companies or ETF sponsors mentioned.
XLE: Diversified Exposure For An Oil Rally

Summary For those who believe the oil market is going to rally, an Energy Sector ETF can provide diversified exposure. I will compare to XLE to two viable alternatives. Broad energy market ETFs reduce single stock and sub-sector risk by providing up, down, and mid stream energy exposure. Introduction I am an ETF believer. I think ETFs reduce cognitive bias and risk. I believe they provide adequate exposure and diversification when utilized properly. Each ETF comes with different equity weightings, expense, volume, yield, correlation, etc., so I have spent time recently comparing key metrics to narrow down the vast number of ETFs on the market. Crude Oil has recently tanked into the mid to low 40s, and some investors believe now is the time to capitalize on a cheap energy market. For those interested in buying into oil and gas, I recommend you avoid risky ETNs like UWTI and UGAZ . Instead, I recommend buying a less risky long-term position in a broad market energy ETF. ETNs and Unnecessary Risk Certain leveraged ETNs provide direct exposure to the oil market; however, I believe some are unnecessarily risky. In this case, a largely traded ETN like the VelocityShares 3X Long Crude Oil ETN (NYSEARCA: UWTI ) would provide an attractive amount of liquidity based on its high trading volume. However, this type of fund is associated with a veritable laundry list of risks including tracking error, compounding risk, and expensive fees. These funds perform sub optimally in flat or declining environments, and they generally decline significantly over time. For more information on the risks of multiplied leverage and daily tracking risk see my article here . To help visualize the sharp decline, I’ll include a relevant graph. Other more conservative options include 1X ETNs that don’t suffer from the same long-term tracking error as a 3X ETN. (2X and 3X ETNs in particular are meant to be used by professionals to accomplish short term objectives.) An example of a direct investment in the oil market includes the United States Oil Fund ETF (NYSEARCA: USO ). In theory, USO would provide a much stronger correlation to the underlying oil market. However, I believe strongly that an ETF designed towards broad market exposure will outperform the underlying oil market. While the 1X ETN has a better correlation, and ETF is not limited strictly by the change in the underlying index (oil price). A well-crafted, highly liquid energy ETF, provides additional incentives such as dividends, and it achieves returns based on the weighted performance of its portfolio holdings. An ETN designed to track an index is limited to the fluctuations of the price of the underlying commodity. A sector ETF on the other hand is based on the growth capabilities and stock performance of its energy holdings. It is clear that XLE is more capable of mitigating its downside in a weak environment whilst maximizing returns in a bull market. I believe companies are able to develop strategies that allow for protection from fluctuations in price. An Oil Rally With Brent at 49.15 and WTI at 42.50, some believe the oil market has been dramatically oversold. The argument for an oil rally is essentially this: overly negative sentiment towards a supply gut and geopolitical events (like the Iran deal) has led to an unprecedented market sell off that has driven oil prices to six year lows. Now is the time to capitalize on cheap oil. We are currently in an environment similar to early March, and oil will return to prices closer to 55-60 dollars a barrel (WTI). If you hold to this belief, I recommend choosing an energy ETF that will perform optimally in a variety of environments. The integrated broad market exposure will allow the investor to reduce the risk of betting solely on the performance of the underlying commodity ((oil)). XLE & Two Alternatives Currently I am invested in the Energy Select Sector SPDR ETF (NYSEARCA: XLE ), and I will make the case for XLE in this article. In an effort to provide you with additional high quality options, I will also analyze the Vanguard Energy ETF (NYSEARCA: VDE ) and the iShares U.S. Energy ETF (NYSEARCA: IYE ). There are other energy plays. Some ETFs focus specifically on the E&P side while others have more exposure to global performance. I liked XLE, VDE, and IYE because they are more focused on North American Companies (Exxon (NYSE: XOM ), Chevron (NYSE: CVX ), Etc.) with a global presence in all aspects of the energy market. These ETFs are also have the largest amount of net assets and provide desirable liquidity. Correlation I always mention correlation because you want the ETF to closely track (if not outperform) the underlying index. If it does not do this, then the ETF is likely inefficiently weighted. With long plays, short term correlation is less important, but I will include a graph to show how each ETF performs relative to its index. ^SS1J data by YCharts I compared each ETF to the S&P 500 Equal Weighted Energy Sector Level % change. it is not a perfect correlation, but it does express the close relative grouping of each. Really all I’m looking for here is that each ETF does what it says it will do. Looking closer into 5-year returns, you’ll notice XLE outperformed both VDE and IYE by about 3.5%. Brief Portfolio Composition Look Each ETF is weighted towards each subsector of the broad energy market differently. For this reason, there is variety of tracking error and diversification differentiation. I made an excel sheet to express each sub-sector weighting. Portfolio Composition XLE VDE IYE Integrated Oil and Gas 32% 32% 34% E&P 29% 30% 31% Equipment & Service 17% 16% 17% Pipelines 10% 11% 7% Refiners 10% 8% 7% Drillers, Coal, Etc. 1% 2% 3% Key ETF Metrics I included some key metrics to make a valid comparison. While it does not necessarily dive into weighting or historical returns, it does help narrow down specific areas to think about. XLE VDE IYE Total Assets 11.28 Bil 3.68 Bil 1.19 Bil Avg. Volume 19.9 Mil 456,395 1.1 Mil Expense 0.15% 0.12% 0.45% SEC Yield 2.93% 3.01% 2.28% Turnover Ratio 5.25% 4.00% 7.00% Recommendation All three ETFs are tactical plays that offer exposure to the U.S. energy sector without taking on too much single equity risk. Historically XLE has performed the strongest in most market conditions. I attribute this to XLE’s large net assets and broad exposure (particularly downstream: refiners, pipelines etc.) Storage and Pipelines are not as hurt by excess supply because price reductions are mitigated by increased service demand. XLE has desirable liquidity, and it is extremely cheap (15 Basis points) with a near 3% yield. I believe XLE is the best energy ETF on the market. Disclosure: I am/we are long XLE. (More…) I wrote this article myself, and it expresses my own opinions. I am not receiving compensation for it (other than from Seeking Alpha). I have no business relationship with any company whose stock is mentioned in this article.

A Race Against Volatility And Bearish Sentiment For The United States Oil ETF

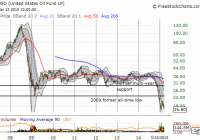
Summary Option-implied volatility on oil is at levels seen during the financial crisis, and short-term volatility on the United States Oil ETF has soared. While current momentum and fundamentals strongly favor the bears, it seems a recent large long-term bet against volatility is the best risk/reward trade on the United States Oil ETF. An analysis of the timing of various United States Oil ETF trades shows a strong bearish short-term opinion that is very reactive and a telling dispersion of longer-term opinion. On March 5, 2015, Barron’s Blogs published a short article on a large bet against volatility on the United States Oil ETF (NYSEARCA: USO ) called ” Big Options Bet Sees Oil ETF Rangebound into 2017.” The possibilities intrigued me because USO enjoyed a remarkable 5-year period of range-bound trading before the current plunge. After the bounce from 2009 lows, USO hit a high of around $46 in 2011 and a low of $29 once in 2011 and again in 2012. An extended period of relative tranquility has been rudely interrupted Directionless, long-term bets seem very reasonable especially given the runway allowed to close-out the trade at a profit well ahead of expiration. The key quote from the blog post: Energy-sector analysts continue debate the supply and demand picture, but one trader in the options market stepped up to the plate with a notably large, long-term wager oil stability. Andrew Wilkinson at Interactive Brokers noted the so-called ‘straddle’ position, which involved the simultaneous sale of ‘put’ options and ‘call’ options that expire way out in January 2017. Options are contracts that allow investors to buy or sell shares at a set price at a specific period of time. Selling options requires a bet against the underlying equity trading “in the money” by expiration. For call options, it is a bet that the underlying will close below the strike price plus the option premium. For put options, it is a bet that the underlying will close above the strike price minus the option premium. Selling BOTH call and put options on the same underlying is a bet that the underlying will stay within a range over time AND that volatility will generally decline over this time. If the underlying falls too far or gains too much too soon, losses could be great enough to force the trader to abandon the bet at a large loss. The Barron’s blog indicated that the big trade will work as long as USO remains within the range of $12.30/share to $25.70/share. It did not provide the specific strikes, so I directly reviewed the Jan 2017 strikes for large increases in open interest. After this process, I concluded that the swell of negative short-term bets combined with the dispersion of opinion on longer-term bets makes a directionless bet more intriguing. I used the options information in Etrade.com to look at the open interest on individual options as of the close Friday, March 13, 2015. The January 2017 calls with the largest open interest have strikes of $19 and $20 at 21,199 and 23,626 options, respectively. The January 2017 put options with the largest open interest have strikes of $19 and $20 as well at 20,178 and 17,975 options, respectively. There are no other strikes that even come close to these. Looking at the history of open interest, I found that the Jan $20 calls and Jan $20 puts have experienced steady increases in open interest since mid-January and early February, respectively. On the other hand, the Jan $19 calls and Jan $19 puts have both experienced large leaps in open interest. The open interest on the call options more than doubled to about 12,500 options on March 5th. The open interest on the put options went from a mere 2,500 or so to about 12,500 on March 5th. In both cases, traders have clearly piled into calls and puts on top of the initial surge – perhaps in imitation of the short straddle, perhaps as a result of differing interpretations on the implications for the large options trades. For reference, I looked at the other long-term options available for trading: the January 2016 expiration. Open interest in the January 2016 options is quite diverse. For call options, the top open interest sits at $25 with no other strike anywhere close to the 44,445 options. This is of course, right at the top of the range that the January 2017 trader is betting on. There are a cluster of call options ranging from 34,667 to 20,988 open interest scattered across $18, $20, $21, $28, $35 and $30 strikes in descending order. For put options, the $16 strike has an open interest of 52,625 with the $18 strike at a close second with 41,748 open interest. In the case of the call options, clearly some of the bets are very speculative. The calls at the $35 strike have been bought mainly in three separate chunks once in each of the months of November, December, and January at prices around $1.10, $0.45, and $0.17, respectively. So from the lens of individual options on a longer-term basis, the bets for or against USO represent a spread of market opinions. On a short-term basis, the opinion on USO is definitively negative although sentiment has hit even more negative levels before the big sell-off started. This sentiment has created substantial premiums on puts options. Schaeffer’s Investment Research calculates an open interest put/call ratio based on the options expiring within three months. It represents immediate market sentiment. The chart below shows three large spikes in the ratio; only the third turned out to be significant. Yet, traders still rapidly got more (relatively) bullish as the sell-off got underway. After hitting a major low, the ratio only tentatively stair-stepped its way higher until it finally soared in the past month AFTER USO made its last all-time low. The overall open interest put/call ratio stair-stepped tentatively until AFTER USO made its last major low In other words, the market only recently started to accept the bearish nature of the trading in USO as a result of the bearish fundamentals of on-going inventory builds and STILL rising production in oil (not to mention the contango conditions which promise to drag USO further down as the fund rolls over futures positions). Last week, Kuwait suggested that OPEC will continue its production policy in its upcoming June meeting. Also last week, the International Energy Agency (IEA) said …U.S. supply so far shows precious little sign of slowing down. Quite to the contrary, it continues to defy expectations. The organization does not expect production growth to slow until the second half of 2015. U.S. crude inventories are now at a record 468M barrels. (See Reuters ” IEA sees renewed pressure on oil prices as glut worsens” for more details on these developments). I suspect the issue of supply cuts will finally get forced when the marginal buyers of oil have to exit the market for lack of storage. At THAT point, perhaps some kind of sustainable bottom in oil will begin. In the meantime, the pressure on oil prices has created a surge in related measured volatility. The Bank of England recently published this spider chart showing option-implied volatility for oil is at levels seen during the financial crisis. Volatility across financial markets has expanded rapidly from last year’s levels – oil stands out as having reached levels of volatility equal to those of the financial crisis Schaeffer’s Investment Research calculates its own volatility index, the SVI, on individual equities. I believe it uses the front and second month options for its calculation . The SVI for USO has surged to tremendous highs but it has actually come off in recent weeks, likely a reflection of the relief from USO’s jump from recent lows. It took a while for the market to accept the tremendous downside potential on USO. The volatility index did not even reach a new high until the sell-off was about 3 months old. The volatility index on USO peaked just after its recent low. Source: Schaeffer’s Investment Research The behavior of the SVI suggests that the market in USO is very reactive rather than predictive. The extreme in the option-implied volatility on oil suggests that we are closer to the end than the beginning of the volatility spike in oil. If volatility measures on USO, like SVI, manage to make fresh highs, such a move could represent a final washout of negative sentiment. Time seems to be on the side of the big seller of the straddle on January 2017 options. Like the open interest put/call ratio, it took the failure of OPEC’s November meeting to prop up prices for USO shorts to get really serious. In other words, there was a lot of latent expectation (hope?) that OPEC would succeed in efforts to manipulate the market. Shares short on USO are now back to levels last seen in the summer of 2013. Note how that ramp evaporated quickly after USO declined mildly for a few months. Shares short on USO were sitting at a major low one month into the sell-off… Here is a close-up showing how fast shorts piled up after the OPEC late November meeting. For example, shares short soared over 50% from December 1 to December 15. …and shares short did not take-off in earnest until December (after OPEC could not decide to cut production to try to prop up prices) As of the time of completing this piece, USO cracked a new all-time low as WTI crude hit lows not seen since March, 2009. The mild optimism that built from the earnings reports of various oil companies has faded in the wake of the market realities that continue to pressure oil lower. United States Oil ETF makes a new (intraday) all-time low shortly after opening for trading on March 16, 2015 Source: FreeStockCharts.com As I mentioned earlier, I think a major market event like an actual decline in U.S. inventories or the complete filling of storage capacity might be required to signal a more sustainable bottom in oil prices. Ahead of that, selling long-term volatility while premiums are high could be the best risk/reward trade available on USO. Until a major market event, the shorter-term momentum looks firmly in favor of the bears. Be careful out there! Disclosure: The author has no positions in any stocks mentioned, but may initiate a short position in USO over the next 72 hours. (More…) The author wrote this article themselves, and it expresses their own opinions. The author is not receiving compensation for it (other than from Seeking Alpha). The author has no business relationship with any company whose stock is mentioned in this article. Additional disclosure: Note that I may open a short and/or long position on USO in the next 72 hours. See article for more details.