Tag Archives: undefined

RSX: Bear Thesis In Progress

Summary The Greek drama and news that sanctions on Iran could be lifted put serious pressure on oil prices. The Ruble will continue to weaken. The Saudi deal does not impact the short thesis. I’ve recently written an article on the Market Vectors Russia ETF (NYSE: RSX ), where I outlined my bear thesis on the Russian market. The situation evolved fast. When the initial article was published, Brent oil was trading near $63. As I am writing this article, Brent oil trades at $57.50 after it touched $55.60. This was a spectacular movement, and I even got a message from a reader who was wondering whether it was time to buy RSX. The rationale of such thesis is quite simple – oil often rebounds after big moves. I think that this reader was not the only one wondering whether the plunge in oil was the opportunity to buy RSX at cheaper prices, so I decided to write a follow-up on my initial thesis. The Russian ruble – not as weak as I expected My initial thesis consisted of three main points: Russian ruble will weaken, the economy will continue to suffer and oil will drop. I will revisit them one by one. Since June 26, the ruble tumbled 4% against the dollar. The movement against the basket of currencies, which consists of dollar and euro, was more modest. I expected that ruble would be weaker. Many factors affect the value of the Russian currency, but the main factor is the price of oil. The oil price is the key variable for both the Russian economy and the Russian budget. It’s the price of oil in rubles that matters for the Russian budget. In the end of 2014, several Russian officials stated that the “comfortable” price of oil was 3600 rubles per barrel. However, as oil plunged and ruble tumbled, stabilization of the national currency became a top priority. Back in June 26, the oil price denominated in rubles was 3467. As I’m writing this article, the price of oil fell to 3277 rubles. In my initial article, I stated that the Russian budget was stretched. At the same time, the Russian Central Bank started to buy dollars at the open market to bring the country’s reserves back to $500 billion. I think that the price of oil in rubles will soon drift towards 3400-3500 level – either by forces of the market or with a little help from the Russian Central Bank. Even if oil prices stay at current levels, this will lead to further weakness of the ruble and put pressure on dollar-denominated RSX. The economy – deal with Saudi Arabia does not change the big picture Many readers already know that Saudi Arabia decided to invest up to $10 billion in Russia over the next five years. Some people speculate that some of this money could end up on the stock market. In my view, this will not be the case. What is important is the duration of the deal – five years, and the sectors – agriculture, medicine, logistics, retail and real estate. While the economy matters a lot when you buy a Russian market ETF, the fate of the actual holdings of this ETF matters more. The majority of the money will be spent on agricultural projects, and there is no agricultural producers in RSX’s holdings . Among related companies, Uralkali, the Russian producer of potash, accounts for just 2.02% of RSX’s holdings. All in all, I think that this news do not change the bear thesis. The oil plunge The Greek drama and news that sanctions on Iran could be lifted put serious pressure on oil prices. In my view, the story is far from its end. I think that oil still has room to fall, especially if the nuclear deal with Iran is successful. As I highlighted in my initial article, I believe that there is a structural imbalance between supply and demand. In my opinion, the strength of oil prices’ reaction to negative news confirms this thesis. Bottom line Let me guess your ultimate bullish argument: in a five-year period, Russian market will be higher as oil rebounds, sanctions are lifted and investors realize how cheap Russian stocks are. That may be true. However, a bearish thesis on a country is by definition not designed for five-year time frames. In shorter time frames, the bearish thesis remains valid. I expect that weaker ruble, poor economy and falling oil will continue to put pressure on RSX. Disclosure: I am/we are short RSX. (More…) I wrote this article myself, and it expresses my own opinions. I am not receiving compensation for it (other than from Seeking Alpha). I have no business relationship with any company whose stock is mentioned in this article.
QQQ’s 2015 2nd-Quarter Performance And Seasonality

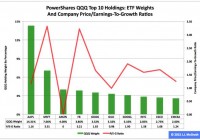
Summary The large-capitalization PowerShares QQQ behaved better in the first half than did the large-cap SPDR S&P 500 ETF. In the second quarter, the adjusted closing daily share price of the derivative of the Nasdaq-100 Index rose by 1.63 percent. In June, the fund’s share price fell by -2.48 percent. PowerShares QQQ’s (NASDAQ: QQQ ) adjusted closing daily share price in 2015’s first half ascended to $107.07 from $103.01, a climb of $4.06, or 3.94 percent. During the period, the ETF behaved better than the SPDR S&P 500 ETF (NYSEARCA: SPY ) by 2.83 percentage points and worse than the SPDR S&P MidCap 400 ETF (NYSEARCA: MDY ) and the iShares Core S&P Small-Cap ETF (NYSEARCA: IJR ) by -14 and -8 basis points, in that order. QQQ last quarter led SPY, IJR and MDY by 1.40, 1.46 and 2.74 percentage points, respectively. And most recently, QQQ last month lagged IJR, MDY and SPY by -3.54 percentage points, 1.21 percentage points and 47 basis points, respectively. Comparisons of changes by percentages in QQQ, SPY, MDY, IJR and the small-cap iShares Russell 2000 ETF (NYSEARCA: IWM ) during the first half, over Q2 and in June can be found in charts published in “SPY’s 2015 2nd-Quarter Performance And Seasonality.” Figure 1: PowerShares QQQ Top 10 Holdings, July 2 (click to enlarge) Notes: 1. The QQQ holding-weight-by-percentage scale is on the left (green), and the company price/earnings-to-growth ratio scale is on the right (red). 2. A meaningful P/E-G ratio is incalculable for the generally unprofitable Amazon.com Inc. ( AMZN ). Source: This J.J.’s Risky Business chart is based on data at Invesco’s PowerShares QQQ microsite and FinViz.com (both current as of July 2). QQQ’s constituent companies in general and its top 10 holdings in particular have a tendency to do big business in both domestic and foreign markets (Figure 1). Their sales’ geographic diversification has been an issue during the past year and will be an issue over the next year primarily because of the bias divergence in monetary policy at large central banks around the world, with the U.S. Federal Reserve oriented toward tightening and all the others oriented toward loosening. This bias divergence has had major effects on multiple financial markets, such as those centered on currencies. It has led to a stronger U.S. dollar on the one hand and a weaker euro, a weaker Japanese yen, a weaker British pound, a weaker Canadian dollar, a weaker Swedish krona and a weaker Swiss franc on the other hand. Accordingly, American products and services can cost more than their foreign-based competitors’ offerings in July 2015 than they did in July 2014. Apple Inc. (NASDAQ: AAPL ) does not compete materially on price, but many of QQQ’s constituent companies do so in their foreign markets. And I suspect the currency issue played a role in the first quarter, when only six of the ETF’s top 10 holdings beat their analysts’ consensus earnings estimates, according to Zacks . Meanwhile, these holdings’ P/E-G ratios indicate they are more dear than cheap, with equity-market participants assigning these firms valuations ranging from the apparently insane, Amazon.com, to the seemingly sane, Gilead Sciences Inc. (NASDAQ: GILD ). Figure 2: QQQ Monthly Change, 2015 Vs. 2000-2014 Mean (click to enlarge) Source: This J.J.’s Risky Business chart is based on analyses of adjusted closing monthly share prices at Yahoo Finance . QQQ performed a lot better in the first half of this year than it did during the comparable periods in its initial 15 full years of existence based on the monthly means calculated by employing data associated with that historical time frame (Figure 2). The same data set shows the average year’s weakest quarter was the third, with a relatively small negative return, and its strongest quarter was the fourth, with an absolutely large positive return. Figure 3: QQQ Monthly Change, 2015 Vs. 2000-2014 Median (click to enlarge) Source: This J.J.’s Risky Business chart is based on analyses of adjusted closing monthly share prices at Yahoo Finance. QQQ performed a lot worse in the first half of this year than it did during the comparable periods in its initial 15 full years of existence based on the monthly means calculated by using data associated with that historical time frame (Figure 2). The same data set shows the average year’s weakest quarter was the first, with a relatively small positive return, and its strongest quarter was the fourth, with an absolutely large positive return. Disclaimer: The opinions expressed herein by the author do not constitute an investment recommendation, and they are unsuitable for employment in the making of investment decisions. The opinions expressed herein address only certain aspects of potential investment in any securities and cannot substitute for comprehensive investment analysis. The opinions expressed herein are based on an incomplete set of information, illustrative in nature, and limited in scope. In addition, the opinions expressed herein reflect the author’s best judgment as of the date of publication, and they are subject to change without notice. Disclosure: I/we have no positions in any stocks mentioned, and no plans to initiate any positions within the next 72 hours. (More…) I wrote this article myself, and it expresses my own opinions. I am not receiving compensation for it (other than from Seeking Alpha). I have no business relationship with any company whose stock is mentioned in this article.

Sector Factors To Consider With Dividend ETFs

Summary Dividend stock ETFs have been losing assets as Treasuries sold off and yields rose. The selling pressure in dividends provides a warning for what could occur in a rising rate environment. A good chunk of dividend ETF portfolios are allocated in utility stocks, which are sensitive to changes in interest rates. By Todd Shriber & Tom Lydon Thanks to the jump in Treasury yields, a rise that has been fueled by speculation the Federal Reserve will soon raise interest rates, investors are departing some noteworthy dividend exchange traded funds. Of the four largest dividend ETFs, only the Vanguard High Dividend Yield ETF (NYSEArca: VYM ) has seen inflows this year, while the iShares Select Dividend ETF (NYSEArca: DVY ) is the worst outflows offender of the four due in part to its 31.5% weight to the lagging utilities sector. Once the Federal Reserve hikes interest rates, U.S. dividend stocks and exchange traded funds could experience a meaningful correction after investors piled into the yield-paying assets during the low rate environment. That is particularly true of dividend ETFs with big weights to rate-sensitive utilities and real estate stocks. Reports Chris Dieterich for Barron’s : Part of the concern: All that money that’s flowed in over the past six years could be yanked out just as quickly, as investors scramble to take profits at the first whiff of market trouble. That’s happened twice over the past two years, first in 2013 and again in the past few months, when the stocks that have fallen hardest were those with the highest yields. Take utilities, the highest yielders among the S&P 500’s 10 industry groups. Utility stocks on the S&P 500 are fresh off a 6.7% plunge in the second quarter, the worst of any U.S. stock sector, while the S&P 500 overall was flat. With Treasury yields climbing, utilities-heavy dividend ETFs are lagging. For example, DVY is off nearly 3% this year while the S&P 500 is up 1.8%. The First Trust Value Line Dividend Index Fund (NYSEArca: FVD ) has lost 1.2% thanks to an almost 23.75 weight to utilities stocks, indicating investors have mistakenly added over $118 million to that ETF this year. On the bright side, recent history shows dividend ETFs can whether the rising Treasury yields storm. That happened in 2013 when Treasury yields surged, but DVY and FVD gained an average of 27.8%, though that lagged the 32.3% returned by the S&P 500. The caveat with 2013 is that the Utilities Select Sector SPDR (NYSEArca: XLU ) gained more than 10%, a feat unlikely to be repeated this year. DVY remains alluring for income ETFs , in part due to a screening methodology that includes dividend growth and payout ratios. However, stock selection by yield could make DVY vulnerable to increased lethargy if Treasury yields continue higher. FVD follows the Value Line Dividend Index, which equally weights components and utilizes the proprietary Value Line research to select components. Specifically, stocks are ranked by the Value Line Safety Ranking of 1 or 2 out of 5, which are based on price stability and financial strength. Additionally, the index excludes stocks with a dividend yield lower than the S&P 500. iShares Select Dividend ETF (click to enlarge) Tom Lydon’s clients own shares of DVY. Disclosure: I am/we are long DVY. (More…) I wrote this article myself, and it expresses my own opinions. I am not receiving compensation for it. I have no business relationship with any company whose stock is mentioned in this article.