Tag Archives: treasury-bond

New Backtests For ETFReplay Portfolio

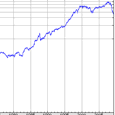
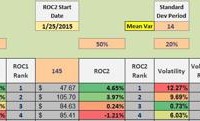
Independent research, long/short equity, dividend investing, ETF investing “}); $$(‘#article_top_info .info_content div’)[0].insert({bottom: $(‘mover’)}); } $(‘article_top_info’).addClassName(test_version); } SeekingAlpha.Initializer.onDOMLoad(function(){ setEvents();}); I am frequently asked about various strategy and portfolio performance metrics and backtests. A reader recently asked if there are any current backtests for the ETFReplay 6/3/3 Portfolio so I decided now is the appropriate time to provide updated results. The strategy background is available here and is updated monthly on Scott’s Investments , including a real-time simulated portfolio spreadsheet here . The ETFReplay portfolio is also provided free to subscribers of Portfolio123 , simply search “ETFReplay” in the Ready-to-Go Portfolio section. The backtested results below are hypothetical and do not account for commissions or taxes, so real results would be lower. The first test was conducted using ETFReplay.com , the initial inspiration for the portfolio. The backtest invests in the Screener’s picks on the close of the first day of the next period. Picks are updated monthly and the top 4 ETFs are purchased/held. ETFs must also be ranked above the iShares 1-3 Year Treasury Bond ETF (NYSEARCA: SHY ) in order to qualify for purchase. This test is nearly identical to the 6/3/3 system I update each month with the exception that the test does not require ETFs drop out of the top 5 before being sold. This was a qualification I added to the strategy to limit turnover. The benchmark for the test is the Vanguard Balanced Index Fund Inv ( VBINX): (click to enlarge) (click to enlarge) The strategy has performed well in total, but has lagged a 60/40 benchmark in the last 3+ years. The Pure Momentum ETFReplay Portfolio was added to my monthly updates in 2014. It purchases 4 ETFs each month based on 6 month returns, and has no cash filter. Backtested returns are below: (click to enlarge) (click to enlarge) We see similarly strong early results, with returns lagging versus the 60/40 benchmark the past 2+ years. Disclosures: None Share this article with a colleague

The 1 Page Portfolio Plan

Long only, ETF investing, portfolio strategy, momentum “}); $$(‘#article_top_info .info_content div’)[0].insert({bottom: $(‘mover’)}); } $(‘article_top_info’).addClassName(test_version); } SeekingAlpha.Initializer.onDOMLoad(function(){ setEvents();}); Develop a saving plan. Use four commission free index ETFs. Diversify without getting too fancy. Set up a momentum strategy not dissimilar to the Dual Momentum model. Challenged to simplify investing for a young person, the following is a one-page investment plan that anyone can follow. While each of the four principles can be expanded into multiple pages, here is the condensed version designed to meet the one-page challenge. The basic principles are: Save as much as you can as early as you can. Use index ETFs. Globalize diversification. Apply a momentum model. The importance of saving cannot be over emphasized as all that follows rests on this bedrock concept. To keep this “investment book” as simple as possible we use only four index ETFs and they are: U.S. Equities (ex. the Vanguard Total Stock Market ETF ( VTI)), International Equities (ex. the Vanguard FTSE All-World ex-US ETF ( VEU)), U.S. Bonds (ex. the Vanguard Intermediate-Term Bond ETF (NYSEARCA: BIV )), and U.S. Treasury (ex. the iShares 1-3 Year Treasury Bond ETF ( SHY)). These four ETFs are commission free with at least one discount broker and they provide global diversification, principle #3. Principle #4 is the most complex and needs a little explanation. Using an ETF ranking spreadsheet (one worksheet shown below), the portfolio is reviewed every 33 days. The four ETFs are ranked every review period and 100% of the portfolio is invested in the top ranked ETF. For investors not comfortable with investing 100% in a single ETF, even though the portfolio would be diversified over hundreds of stocks or bonds, the other option is to invest equal amounts in the top two ranked ETFs. SHY is included as a “cutoff” ETF to avoid major bear markets. (click to enlarge) Follow these four basic principles and you will outperform most professional investors. Disclosure: I am/we are long VTI,VEU. (More…) I wrote this article myself, and it expresses my own opinions. I am not receiving compensation for it (other than from Seeking Alpha). I have no business relationship with any company whose stock is mentioned in this article. Share this article with a colleague

Funds Experience $2.8 Billion In Aggregate Net Outflows

By Patrick Keon The positive performance by the indices came on the heels of negative performance by both for the month of January. The Dow was off 3.6% for the month, while the S&P 500 retreated 3.1%. It was the worst monthly performance for each index since January of last year. A contributing factor to this January’s poor performance as well as the bounce at the start of February was oil. Slumping oil prices caused by oversupply had weighed on the markets. But last week sentiment on the street suggested oil prices may have bottomed, and the demand for energy stocks was the driving force behind the markets’ rally. In this past week’s fund-flows activity, Lipper’s fund macro groups had overall net outflows of $2.8 billion. Money market funds (-$9.9 billion) and equity funds (-$7.1 billion) paced the way for the net outflows, while taxable bond funds (+$13.7 billion) accounted for the lion’s share of the net inflows. Municipal bond funds took in $589 million net for the week. The net inflows into taxable bond funds were split between those to exchange-traded funds (ETFs) (+$8.6 billion net) and mutual funds (+$5.1 billion). On the ETF side, investors were buying iShares Short Treasury Bond ETF ( SHV , +$2.0 billion), iShares 7-10 Year Treasury Bond ETF ( IEF , +$1.3 billion), and iShares 3-7 Year Treasury Bond ETF ( IEI , +$927 million). For mutual funds, Lipper’s Core Plus Bond Funds classification led the way with positive flows of $2.3 billion. Equity ETFs (-$5.7 billion net) accounted for the bulk of the equity outflows, while equity mutual funds saw $1.5 billion leave. SPDR S&P 500 ETF ( SPY , -$2.2 billion) and iShares US Technology ETF ( IYW ,-$1.2 billion) experienced the biggest outflows among the ETFs. Net outflows on the mutual fund side were fairly evenly split between non-domestic equity (-$869 million) and domestic equity (-$608 million) funds. Municipal bond mutual funds took in $422 million net during the week. Once again, funds in the national municipal categories (+$464 million) were the main recipients of the positive flows. Lastly, money market funds saw their coffers reduced by $9.9 billion net during the week. Institutional money market funds (-$6.4 billion) were responsible for the bulk of the outflows. Are you Bullish or Bearish on ? Bullish Bearish Neutral Results for ( ) Thanks for sharing your thoughts. Submit & View Results Skip to results » Share this article with a colleague