Tag Archives: transactionname

Ongoing Exit From Equity Funds Continues 20-Week Streak

“}); $$(‘#article_top_info .info_content div’)[0].insert({bottom: $(‘mover’)}); } $(‘article_top_info’).addClassName(test_version); } SeekingAlpha.Initializer.onDOMLoad(function(){ setEvents();}); By Jeff Tjornehoj Equity mutual fund investors withdrew an estimated $920 million net for the week. Not surprisingly, they pulled money from domestic equity mutual funds (-$2.2 billion)-for a twentieth consecutive week of net outflows for the group. Equity exchange-traded funds (ETFs) saw net inflows of $7.8 billion, although investors turned their backs on emerging markets products (-$346 million) to avoid excess risk. The week’s biggest equity ETF recipient was the SPDR S&P 500 Trust ETF ((NYSEARCA: SPY ) , +$3.0 billion), while modest selling hit the iShares MSCI Emerging Markets ETF ((NYSEARCA: EEM ) , -$342 million ) and the iShares Core S&P 500 ETF ((NYSEARCA: IVV ) , -$477 million). Bond mutual fund investors freaked out on High Yield Funds and pulled $1.7 billion net from that Lipper classification to send taxable bond funds as a whole to a negative $3.4 billion for the week. Mutual fund investors pumped some cash into Lipper’s Core Bond Funds (+$737 million) and Core Plus Bond Funds (+$271 million) classifications. Bond ETF investors pulled $1.8 billion from their accounts to create combined (mutual funds and ETFs) outflows of $5.2 billion-for the largest bond fund outflows since the last week of December 2014. The week’s top individual destination for bond ETF investors was the PowerShares DB USD Bull ETF ((NYSEARCA: UUP ) , +$89 million); outflows of $666 million hit the iShares iBoxx $ High Yield Corporate Bond ETF (NYSEARCA: HYG ) . Municipal bond mutual fund investors pulled $421 million from their accounts for the seventh weekly net outflow in a row. Money market funds saw net outflows of $10.8 billion, of which institutional investors pulled $12.6 billion and retail investors added $1.9 billion. Share this article with a colleague

Today’s Most Competitive Wealth-Builder ETF Investment

Summary From a population of some 350 actively-traded, substantial, and growing ETFs this is a currently attractive addition to a portfolio whose principal objective is wealth accumulation by active investing. We daily evaluate future near-term price gain prospects for quality, market-seasoned ETFs, based on the expectations of market-makers [MMs], drawing on their insights from client order-flows. The analysis of our subject ETF’s price prospects is reinforced by parallel MM forecasts for each of the ETF’s ten largest holdings. Qualitative appraisals of the forecasts are derived from how well the MMs have foreseen subsequent price behaviors following prior forecasts similar to today’s. Size of prospective gains, odds of winning transactions, worst-case price drawdowns, and marketability measures are all taken into account. Today’s most attractive ETF Is the SPDR Biotech ETF (NYSEARCA: XBI ): The investment seeks to provide investment results that, before fees and expenses, correspond generally to the total return performance of an index derived from the biotechnology segment of a U.S. total market composite index. In seeking to track the performance of the S&P Biotechnology Select Industry Index (the “index”), the fund employs a sampling strategy. It generally invests substantially all, but at least 80%, of its total assets in the securities comprising the index. The index represents the biotechnology industry group of the S&P Total Market Index (“S&P TMI”). The fund is non-diversified. The fund currently holds assets of $2.28 billion and has had a YTD price return of +27.87%. Its average daily trading volume of 1,069,010 produces a complete asset turnover calculation in 8.5 days at its current price of $250.86. Behavioral analysis of market-maker hedging actions while providing market liquidity for volume block trades in the ETF by interested major investment funds has produced the recent past (6 month) daily history of implied price range forecasts pictured in Figure 1. Figure 1 (used with permission) The vertical lines of Figure 1 are a visual history of forward-looking expectations of coming prices for the subject ETF. They are NOT a backward-in-time look at actual daily price ranges, but the heavy dot in each range is the ending market quote of the day the forecast was made. What is important in the picture is the balance of upside prospects in comparison to downside concerns. That ratio is expressed in the Range Index [RI], whose number tells what percentage of the whole range lies below the then current price. Today’s Range Index is used to evaluate how well prior forecasts of similar RIs for this ETF have previously worked out. The size of that historic sample is given near the right-hand end of the data line below the picture. The current RI’s size in relation to all available RIs of the past 5 years is indicated in the small blue thumbnail distribution at the bottom of Figure 1. The first items in the data line are current information: The current high and low of the forecast range, and the percent change from the market quote to the top of the range, as a sell target. The Range Index is of the current forecast. Other items of data are all derived from the history of prior forecasts. They stem from applying a T ime- E fficient R isk M anagement D iscipline to hypothetical holdings initiated by the MM forecasts. That discipline requires a next-day closing price cost position be held no longer than 63 market days (3 months) unless first encountered by a market close equal to or above the sell target. The net payoffs are the cumulative average simple percent gains of all such forecast positions, including losses. Days held are average market rather than calendar days held in the sample positions. Drawdown exposure indicates the typical worst-case price experience during those holding periods. Win odds tells what percentage proportion of the sample recovered from the drawdowns to produce a gain. The cred(ibility) ratio compares the sell target prospect with the historic net payoff experiences. Figure 2 provides a longer-time perspective by drawing a once-a week look from the Figure 1 source forecasts, back over two years. Figure 2 (used with permission) What does this ETF hold, causing such price expectations? Figure 3 is a table of securities held by the subject ETF, indicating its concentration in the top ten largest holdings, and their percentage of the ETF’s total value. Figure 3 source: Yahoo Finance XBI apparently takes a low-concentration approach to holdings, with an average of 1 ½% of its assets in each of its top ten commitments. This provides a wide dispersion of holdings among competitive contestants in an industry where success rewards can be huge, while failures tend to be complete. If the remaining 85% of assets are distributed on a 1% basis 95 separate bets may being made, offering great diversification, as well as dilution of encountered bonanzas. Where ultimate payoffs are less dependent on initial capital commitment size, this may be an advantaged strategy. Figure 4 is a table of data lines similar to that contained in Figure 1, for each of the top ten holdings of XBI. Figure 4 (click to enlarge) In an industry as unpredictably dynamic as this, wide variations in market experience seem to be the rule. Column (5) contains the upside price change forecasts between current market prices and the upper limit of prices regarded by MMs as being worth paying for price change protection. The average of +16.3% of the top ten XBI holdings is well above the population average of all 2600+ equities MM forecasts of +12.9%. It is about double the upside forecast for SPY price change prospects. The other side of the coin is column (6), which shows what actual worst-case price drawdowns have been typical in the 3 months following each time there has been a forecast like those of the present day. Those risk exposures have been nearly -10% in the holdings top ten, less than -9 by equities at large, and only -3.5% on the SPY ETF. But these holdings are attractive reward tradeoffs between returns and risks, with the top ten (column 14) at a ratio of 1.7, compared to equities overall at 1.5 times. Still, the market average of SPY provides a best ratio of 2.5 times risk avoidance. Another qualitative consideration is the credibility of the ten XBI big holdings after previous forecasts like today’s. The net average price change (column 13) of the ten has been 1.1 times the size of the upside forecast average, +17.4% compared to +16.3%. The equity population’s actual price gain achievement, net of losses has been a pitiful +3.7% compared to promises of 12.9%. The ability of XBI holdings to recover from those worst-case drawdowns and achieve profits occurred in 84% of experiences. The equity population only recovered less than two thirds of the time, and while the SPY experiences were more consistent like the ten XBI holdings, the achieved gains were much smaller. SPY has had only +3.3% gains previously from like forecasts of +8.6%. Conclusion XBI provides attractive forecast price gains, supported by equally appealing largest holdings. Both the ETF and many of its major holdings offer very attractive prospects in near-term price behaviors, demonstrated by previous experiences following prior similar forecasts by market makers. Disclosure: I/we have no positions in any stocks mentioned, and no plans to initiate any positions within the next 72 hours. (More…) I wrote this article myself, and it expresses my own opinions. I am not receiving compensation for it (other than from Seeking Alpha). I have no business relationship with any company whose stock is mentioned in this article.

Choosing Which Stocks To Sell For A Big Purchase

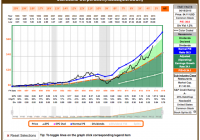
Summary This article outlines the thinking process of needing to sell some stocks for a big purchase. Know how much cash is needed to liquidate from stocks, so as not to sell more than needed. Must keep emotions in check, and sell stocks based on company valuation and future prospects of the business. Here’s a little background story to my situation. The Situation of Being Carless I recently sold my 2001 Toyota Echo. I bought it used about three years ago. The odometer indicates mileage of over 320,000km. While I owned it, other than the usual maintenance, I replaced the battery and the exhaust pipe. I managed to sell it for $500 less than my buying price. Not too shabby. I’m not one who drives a lot, but I only noticed how inconvenient it is after I sold the car. Now, I’m looking for another car. I’m still debating whether to buy a new car or a pre-owned one. Someone that knows a lot more about cars than me said that it’s probably better to buy a new one now that I got several years of driving experience down my belt. Further, it could be risky buying a pre-owned car because I don’t know its history. The previous owner could also have hid facts about crashes the car had experienced or changed the odometer. The ideal situation is that I anticipated I’ll need to “invest” in a car a couple years before and actually saved up for it. As we know, the general principle is to not put money into the stock market if you plan to use it within 5 years. The reality is I did not save up, and I don’t have a lot of cash on hand. So, other than to stop buying stocks in the meantime, I also needed to sell some of my shares. Emotionally, I don’t want to sell at a loss, and some of my holdings are in the red, especially energy companies. At the same time, I also want to take profit in my biggest winners. However, the better way is to try to suppress my emotions, and look at valuations and future earnings estimates instead. So, I should be looking at the valuations of all of my holdings and deciding which ones are possible sells. I especially don’t want to sell my core holdings, but if they’re excessively overvalued, or I feel less comfortable with them for some reason, it might make sense to take some shares off the table and take some profit. Unfortunately, I made some sales before I wrote this article. I notice I’m much more logical and less emotional when I rethink the process in writing. How did I Choose What to Sell? It is through this event that I realize more prominently that I’m less comfortable with some stocks than others. In other words, this exercise more critical helps me determine what I should be holding or not. Further, I also look at valuation, as well as compare a holding’s future prospects with others. Another consideration is gains. The market is uncertainty; it could drop 25-50% for whatever reason at any time period. Still, I would probably regret later by selling some shares in my winners, as some would be against clipping the wings of their winners. Royal Bank of Canada Royal Bank of Canada (NYSE: RY )’s shares are fairly-valued today. F.A.S.T. Graphs shows consensus analyst estimates of 4.7% earnings growth going forward. Adding that to its current yield of 3.9%, it indicates an estimated return of about 8.6% in Royal Bank shares today, which is an acceptable return for a blue chip investment. In Q2 2015, 63% of Royal Bank’s revenue came from Canada. The housing bubble has been the topic at the dinner table in recent years, especially in popular cities such as Vancouver and Toronto. The fear is that the average income cannot pay for the average housing prices. In January 2015, the Huffington Post’s article shows the income you need to buy an average house across Canada . In Toronto, an average household income of C$113,009 is needed for an average-priced house or condo of C$587,505 at the low mortgage rate of 2.99%. The monthly mortgage payment turns out to be C$2,560. If rates rose to 6%, the 2005 rate, the required household income would be raised to C$143,182. It’s worse in Vancouver. An average household income of C$147,023 is needed for an average-priced house or condo of C$819,336 at the low mortgage rate of 2.99%. The monthly mortgage payment ends up being C$3570. If rates rose to 6%, the 2005 rate, the required income would be raised to C$190,581. Of course these numbers are just that — an average. And it also makes a difference how much down payment a family has saved up. Still, it doesn’t change the fact that housing prices have been on the rise for over a decade in those cities. And with income levels misaligning with housing prices, there could be a ripple effect if the prices started to drop. I sold some shares in Royal Bank, and will continue monitoring, but I want to emphasize that if I had cash on hand to make my purchase, I wouldn’t have sold my shares. Baxter International I started a position in Baxter International (NYSE: BAX ) as a non-core. Then, I made it core. And now I sold out of it. It was a small position and I suppose I wasn’t strongly attached to it. I sold it essentially at breakeven. I might still receive a tiny position in Baxalta, as I sold it on June 16, but the settlement date is a few days later, while the company spins off the Baxalta shares to shareholders as of the record date of June 17. If I do receive shares of Baxalta, I’ll be monitoring it and decide if I want to add to the position later on. Starbucks Some of you might stare in disbelief that I sold some shares of Starbucks (NASDAQ: SBUX ). It has been one of my biggest winners with 50% gain. The high P/E is scaring me a little. I certainly wouldn’t add shares at a P/E of 36. Looking at the F.A.S.T. Graph below, it’s at the high end of its valuation. (click to enlarge) If it trades sideways again, so that earnings catch up some, I might add to my position again. Actually, I should have sold McDonald’s (NYSE: MCD ) before selling Starbucks because Starbucks has better future prospects. However, my McDonald’s shares are below my breakeven point, and psychologically, it’s hard for me to separate from those shares at present levels. That said, in hindsight, I shouldn’t have bought McDonald’s at the price that I did. And a thought just came to me…I should have sold McDonald’s at a small loss and kept my Starbucks shares because I believe Starbucks will outperform McDonald’s in the future. Whoops, I guess I should have written this article before I took action. I’m still a bit short on cash, so I might revisit my decision on McDonald’s next week. Microsoft Lastly, I sold some shares in Microsoft (NASDAQ: MSFT ). The other technology companies I hold are International Business Machines (NYSE: IBM ) and Qualcomm (NASDAQ: QCOM ). IBM is a core holding that I believe is much more undervalued than Microsoft. IBM’s P/E is under 11 and Qualcomm’s is under 14, while Microsoft’s is under 18. Consensus analyst estimates Microsoft’s earnings to grow at 6.7% in the near term, Qualcomm’s to grow at 1.3%, and IBM’s to grow at 5.1%. If I didn’t need the money, I wouldn’t sell the Microsoft shares because they’re not excessively overvalued. In Conclusion Looks like I couldn’t keep my emotions entirely at bay, but in writing this article, I believe my thought process became clearer and less sentimental. It would certainly have helped if I had a set of rules for selling stocks ahead of any sales based on allocation, diversification, quality, valuation, and future prospects. Ask Yourself Do you need to sell some of your stocks to make a purchase? Do you have a set of rules to determine what to sell when you need to? Do you ever sell for the sake of taking profit off the table to preserve gains and capital? If you like what you’ve just read, please consider clicking the “Follow” link at the top of the page, above the article title, to receive an email notification when I publish a new article. Disclosure: I am/we are long IBM, MCD, MSFT, QCOM, RY, SBUX. (More…) I wrote this article myself, and it expresses my own opinions. I am not receiving compensation for it (other than from Seeking Alpha). I have no business relationship with any company whose stock is mentioned in this article. Additional disclosure: I’m not a certified financial advisor, and this article is not advising to buy or sell any security. Please use it as initial research.