Tag Archives: top-ideas

Best S&P 500 Utility Stocks According To A Winning Ranking System: A Look At Exelon

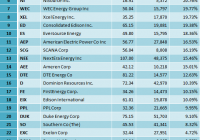
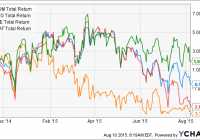
Summary Ranking the top twenty S&P 500 utility stocks according to a winning ranking system. Explanation and back-testing of the “ValueSheet” ranking system. Description and a buy recommendation for the first-ranked stock of the system: Exelon Corporation (EXC). S&P 500 utility stocks have given, on average, a similar return to that of the S&P 500 index over the last year. The average return of the 29 S&P 500 utility stocks that are included in the S&P 500 index (included dividends) in the last 52 weeks has been 10.51%, while the S&P 500 index has returned 9.77%. The table below shows all S&P 500 utility companies, ranked according to their 52 weeks return. A Ranking system sorts stocks from best to worst based on a set of weighted factors. Portfolio123 has a ranking system which allows the user to create complex formulas according to many different criteria. They also have highly useful several groups of pre-built ranking systems, I used one of them the “ValueSheet” in this article. The “ValueSheet” ranking system is quite complex, and it is taking into account many factors like; valuation ratios, growth rates, profitability ratios, financial strength, asset utilization, technical rank, industry rank, and industry leadership, as shown in Portfolio123’s chart below. In order to find out how such a ranking formula would have performed during the last 16 years, I ran a back-test, which is available by the Portfolio123’s screener. For the back-test, I took all the 6,651 stocks in the Portfolio123’s database. The back-test results are shown in the chart below. For the back-test, I divided the 6,651 companies into twenty groups according to their ranking. The chart clearly shows that the average annual return has a very significant positive correlation to the “ValueSheet” rank. The highest ranked group with the ranking score of 95-100, which is shown by the light blue column in the chart, has given by far the best return, an average annual return of about 18%, while the average annual return of the S&P 500 index during the same period was about 3.5% (the red column at the left part of the chart). Also, the second and the third group (scored: 90-95 and 85-90) have given superior returns. This brings me to the conclusion that the ranking system is very useful. After running the “ValueSheet” ranking system on all S&P 500 utility stocks on August 09, I discovered the twenty best stocks, which are shown in the table below. In this article, I will focus on the first-ranked stock; Exelon Corporation (NYSE: EXC ). (click to enlarge) On July 29, Exelon reported its second quarter 2015 results and narrowed its full-year operating earnings guidance to $2.35 to $2.55 per share. Exelon achieved earnings above its guidance range in the quarter, led by a strong financial performance at Constellation. The company beat EPS expectations in the last quarter by $0.05 (9.3%). The major drivers for the beat were reduced outages at ExGen’s nuclear plants and lower uncollectibles at Baltimore Gas & Electric. Revenue grew 5.1% to $6.51 billion in the period. Exelon showed earnings per share surprise in its last two-quarters after missing estimates in the previous quarter, as shown in the table below. Source: Yahoo Finance Despite low power prices and challenging market conditions in the wholesale power markets, I see healthy growth prospects for the company. The proposed all-cash acquisition, pending approvals, of Pepco (NYSE: POM ), will help to boost Exelon’s earnings growth rate. The merger continues to be conditioned upon approval by the Public Service Commission of the District of Columbia. Exelon expects the merger to be completed in the third quarter of 2015. On the regulated side, the forthcoming Pepco merger should bring opportunities for investment and operational improvement, as well as an additional regulated earnings stream to support the dividend. Also, the coming industry coal plant retirements will lower future reserve margins and would lead to higher electricity prices. In another development, the company plans, in September, to decide what nuclear plant will be retired due to uneconomic operational conditions. Exelon continues to evaluate the viability of three of its nuclear plants in Illinois (Byron, Quad Cities, and Clinton) given that the Illinois legislative session ended without a resolution on the low carbon portfolio. Valuation EXC’s stock has underperformed the market in the last few years. The stock is down 12.5% year-to-date while the S&P 500 index has increased 0.9%, and the Nasdaq Composite Index has gained 6.5%. Moreover, since the beginning of 2013, EXC’s stock has gained only 9.1% while the S&P 500 index has increased 45.7%, and the Nasdaq Composite Index has risen 67%. However, In my opinion, EXC’s stock is a clear value with the stock having faded more than its fundamentals and key catalysts. (click to enlarge) Chart: TradeStation Group, Inc. Exelon’s valuation metrics are excellent, the trailing P/E is very low at 11.97, the forward P/E is low at 13.40, and its price-to-sales ratio is also very low at 0.95. Furthermore, its Enterprise Value/EBITDA ratio is very low at 6.76, the lowest among all S&P 500 utility stocks. Source: Portfolio123 Exelon is paying a generous dividend. The forward annual dividend yield is pretty high at 3.82% and the payout ratio is at 45.8%. However, the annual rate of dividend growth over the past five years was negative at -10%. Summary Exelon delivered better than expected second quarter results and narrowed its full-year operating earnings guidance to $2.35 to $2.55 per share. Exelon achieved earnings above its guidance range in the quarter, led by a strong financial performance at Constellation. Despite low power prices and challenging market conditions in the wholesale power markets, I see healthy growth prospects for the company. The proposed all-cash acquisition, pending approvals, of Pepco, will help to boost Exelon’s earnings growth rate. Exelon has compelling valuation; its EV/EBITDA ratio of 6.76 is the lowest among all S&P 500 utility stocks. In my view, the recent retreat in its price offers an excellent opportunity to buy the stock at a cheap price. Disclosure: I/we have no positions in any stocks mentioned, and no plans to initiate any positions within the next 72 hours. (More…) I wrote this article myself, and it expresses my own opinions. I am not receiving compensation for it (other than from Seeking Alpha). I have no business relationship with any company whose stock is mentioned in this article.

An Update On 4 Tactical/Momentum ETFs

Summary Four tactical/momentum ETFs debuted in late 2014. These ETFs have the ability to switch between equities, bonds or other assets based on trailing momentum and/or volatility. How have these ETFs fared in the 9 months since inception? Introduction In a previous article , I discussed the debut of 4 tactical/momentum ETFs. Broadly speaking, these ETFs aim to exploit the momentum factor, which is often regarded as the premier anomaly due to its persistent outperformance over long periods of time. Stocks that have done well recently tend to continue to do well, while stocks that have done poorly recently tend to continue to do poorly. The momentum concept is embodied in aphorisms such as “Cut your losers and let your winners run.” Momentum works well not only within asset classes, but also between them. A momentum strategy that switches between stocks and bonds, for example (also known as “tactical” allocation), may well have allowed an investor to avoid the worst stock market crashes in history. A number of Seeking Alpha authors have presented various simple momentum strategies that have highly impressive backtested performance, such as varan , Frank Grossman and others. Recently, Left Banker described his own momentum strategy that had him reaping the rewards of treasury bonds in 2014. For investors who lack the time or inclination to implement their own tactical/momentum strategies, ETFs may be a valid alternative. Four such ETFs were launched in October or November of 2014. Cambria Global Momentum ETF (NYSEARCA: GMOM ) Global X JPMorgan US Sector Rotator Index ETF (NYSEARCA: SCTO ) Global X JPMorgan Efficiente Index ETF (NYSEARCA: EFFE ) Arrow DWA Tactical ETF (NASDAQ: DWAT ) For further details on the methodology of each of these ETFs, please see my previous article . Note that all four funds have the ability, at the minimum, to switch between equities and bonds. Hence, equity-only momentum funds, of which there are many, were excluded from this comparison. Given that it has been around 9 months since the debut of these four ETFs, I thought it would be a good time to assess their performance since their inception. Results The total return history of the four ETFs since the inception date of the newest fund (Nov. 2014) is shown below. GMOM Total Return Price data by YCharts The chart above shows that DWAT has had the highest total return of 1.94%, while SCTO has the lowest return of -3.33%. How does this compare with some of the most common benchmarks? The following 12 asset classes were selected as a comparison: U.S. equities (NYSEARCA: SPY ) Developed markets ex-U.S. equities (EAFE) Emerging market equities (NYSEARCA: EEM ) U.S. long-term treasuries (NYSEARCA: TLT ) U.S. intermediate-term treasuries (NYSEARCA: IEF ) U.S. investment grade bonds (NYSEARCA: LQD ) U.S. high-yield bonds (NYSEARCA: JNK ) Emerging market bonds (NYSEARCA: EMB ) U.S. real estate (NYSEARCA: VNQ ) Ex-U.S. real estate (NASDAQ: VNQI ) Commodities (NYSEARCA: DBC ) Global market portfolio (NYSEARCA: GAA ) The following bar chart shows the total return performances of the four tactical/momentum ETFs plus the 12 asset classes since Nov. 2014. The tactical/momentum ETFs are shown in green, equities in blue, bonds in red and other asset classes in yellow. We can see from the chart above that there has been quite a wide dispersion of return performances, with the highest being TLT at 6.35% and the lowest being DBC at -30.2%. The following chart is the same as that above except with DBC removed, in order to make the differences between the other funds easier to visualize. Discussion At first glance, it seems that the four tactical/momentum ETFs underperformed. U.S. stocks, as represented by SPY, returned 5.35% over the past 9 months, while the four U.S. bond ETFs averaged 1.57%. In contrast, the four tactical/momentum ETFs averaged only -1.19%. However, as Seeking Alpha author GestaltU has convincingly argued , a 60/40 U.S. stock/bond mix is not an appropriate benchmark for global tactical asset allocation [GTAA] strategies. Instead, the benchmark should be the investible global market portfolio [GMP]. This portfolio is nicely represented by the Cambria Global Asset Allocation ETF, ticker symbol GAA, which is the last asset class data point shown in the charts above. GAA returned -1.02% over the past nine months. This suggests that the four tactical/momentum ETFs did not significantly underperform this benchmark over the past nine months. Conclusions This article provides an update to four tactical/momentum ETFs that were launched around nine months ago. With domestic equities continuing to grind higher, many investors have been considering reducing their exposure to this space. For investors uncomfortable with market timing (like myself), the use of a tactical/momentum fund may allow investors to, in an ostensibly “passive” manner, stay invested in the outperforming markets such as the U.S. until the tide turns. However, this study also revealed a drawback of the tactical/momentum funds. None of these ETFs were apparently able to capture the full, or even any, upside of the domestic equity market (+5.35%) over the past nine months; in fact, as a group, the four ETFs exhibited a negative total return of -1.19%. This is especially surprising for SCTO (-3.33%), which invests only in U.S. sectors and/or U.S. short-term treasuries, and nothing else. Thus, investors should not expect the tactical ETFs to keep pace with the U.S. bull market, if it continues. Disclosure: I am/we are long GMOM. (More…) I wrote this article myself, and it expresses my own opinions. I am not receiving compensation for it (other than from Seeking Alpha). I have no business relationship with any company whose stock is mentioned in this article.

Buying The Next Hot Idea

If you want to know what is the core problem of the average person approaching the market (though this applies more to males than females, women have more native caution on average), it is chasing a hot idea. This can take a number of forms: Getting tips from friends who have bought some stock that is currently popular in the market. Doing the same thing with investors who talk or write about investing. The best investment advice is not flashy, and does not make for good video. Looking at charts and buying something that is rising rapidly, because popular media say this is “The Next Big Thing.” Buying the mutual fund or other pooled vehicle of some manager who has done very well in the past, and seems to never fail. (If you buy a mutual fund, don’t buy one that has had a lot of money pile into it recently… usually a bad sign. Spend more time to see if the manager thinks in a businesslike way about assets that he buys.) Going to a broker who is very well-dressed and confident, and talks really well, but who has no obligation to act in your best interests. If you don’t know how he is earning his money from you, avoid him, because it usually means investments with high fees or hidden ways that you can lose, e.g. structured notes that offer a nice yield, but where possibilities to lose are more significant than you think. At best, he will give you consensus ideas and managers that deliver him above average remuneration. Buying the newsletter of some overly confident person who claims to know the secrets of the market, which he will share with you and 100,000 other close friends for a mere $299/year! (Please read Mark Hulbert before buying a newsletter.) Worse yet, giving into the fakery of those who try to bring you into a hidden opportunity. It can be a Ponzi scheme, a promoted stock, but they suggest returns that are huge… or, like Madoff, decent but not exorbitant returns that are altogether too regular. Many of these appeal to our desire to get something for nothing, which is endemic – we all have it to some degree, and marketers play off this regularly by offering us “free” this, and “free” that. Earning returns from your investable assets is a business in its own right, and there are costs to doing it well. You should not be surprised that doing well with it will take some time and effort. You also have to avoid the impulse that there is some hidden knowledge, or group of insiders that have found an easy road to riches. The markets aren’t rigged in any material way. The principles of investing are well-known, but applying them takes creativity, time and effort. There are no significant players with a new theory who make amazing money investing in secondary markets for stocks and bonds. Most of the things that I listed above involve low-thought imitation of others. There is little advantage in investing to mimicry. Even if it worked for someone else, the prices are different now, and easy gains have been made. You will do worse than the one you are trying to imitate with virtual certainty, and likely worse than average. You need to plan to take an independent course, and learn enough such that if you do choose to use advice of any sort, that you can evaluate it rationally. If you choose to do it yourself, you will need to learn more than that. It takes effort, but that effort will pay off, if not in investing itself, but there are spillover effects in intelligent management of your finances, and in improving your abilities in the businesses that you serve. In most areas of life, most things that pay off well take effort. If people present you with easy or hidden ways to make above average money, be skeptical. Doing it right takes discipline and effort. (If you want the easy route while avoiding all the pitfalls see the postscript. It is boring, but it works.) As an aside – you can always index, and beat most average investors over the long haul. Buy broad funds that invest in a large fraction of all of the stocks that there are, and those that replicate the bond market as a whole. Make sure they have low fees. Buy them, hold them, and be done. You will still face one hurdle: will you be able to maintain your strategy when everything is in a crisis, or when your friends tell you they are earning a lot more than you, and it is easy to do it? Size the bond portion of your assets to the level where you can sleep soundly in all circumstances, and you will be fine. Disclosure: None