Tag Archives: stocks

Best Performing Energy Mutual Funds Of Q2 2015
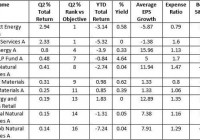
Despite crude prices rebounding in March this year and trending up before hitting a roadblock again this month, energy prices were nonetheless far short of their year-ago levels. Nevertheless, the energy sector enjoyed improving fundamentals in the second quarter. The U.S. Energy Department’s weekly inventory had shown that crude stockpiles continued to fall and continued to set new records. The federal government’s EIA report had also revealed that crude inventories were down. However, this could not translate into significant gains for energy mutual funds in the second quarter. According to Morningstar, in the 3-month period, energy sector mutual funds lost 3.8%. Of the 200 funds under the study, only 39 funds could finish in the green. The highest gain reached just 2.9% and the average gain for these 39 funds is 0.6%. Compared to the average loss for the remaining 161 funds of -2%. The biggest loss of -5.5% came from US Global Investors Global Res (MUTF: PSPFX ), which currently holds a Zacks Mutual Fund Rank #5 (Strong Sell). (Note: This number includes the same funds of different classes) Weakness in energy is also prominent in earnings projections. Per the Earnings Trends, the second quarter earnings for the Oil/Energy sector may slump 61% on 39.3% lower revenues. The earnings analysis pertains to the S&P 500 index. Moreover, it was also a tough quarter for the broader markets. The Dow was the only benchmark in the first quarter to end in the red, but the S&P 500 joined the blue-chip index in negative territory in the second quarter. Just 41% of mutual funds could manage to finish in the green in the second quarter. This is less than half of the 81% gains scored by mutual funds in the first quarter. Crude Price Slump Again The downtrend is again creating jitters. In mid-July, the crude had the steepest one-day fall in over three months. West Texas Intermediate (WTI) crude had plunged 8.4%. This was the largest one-day percentage decline since February. Now, the Iran deal is a major headwind. After 20 months of negotiations, a nuclear deal has been reached between Iran and six world powers. The agreement is meant to restrict Iran from manufacturing nuclear weapons in exchange of removing economic sanctions – which also include constraining crude oil export from Tehran. But the big question that arises is how the nuclear accord might impact the oil market. However, it will take Iran months or more to ramp up its production to previous levels. Moreover, it will take around two months for the U.S. to get congressional approval for the nuclear pact, indicating that the sanctions won’t be removed immediately. Top 10 Energy Funds of Q2 2015 Below we present the top 10 Energy funds with best returns of Q2 2015: (click to enlarge) Note: The list excludes the same funds with different classes, and institutional funds have been excluded. Funds having minimum initial investment above $5000 have been excluded. Q2 % Rank vs Objective* equals the percentage the fund falls among its peers. Here, 1 being the best and 99 being the worst. As already discussed, the Q2 gains are really muted. However, these 10 funds could at least reverse the losing trend for the overall energy category. Gains of the bottom 3 here, Baron Energy and Resources Retail (MUTF: BENFX ), Putnam Global Natural Resources A (MUTF: EBERX ) and JPMorgan Glob Natural Resources A, are below 0.2%. Here, BENFX and EBERX carry a Zacks Mutual Fund Rank #1 (Strong Buy). Both these funds have a healthy average EPS growth. Joining them in this category of promising average EPS growth are Invesco Energy A (MUTF: IENAX ) and RS Global Natural Resources A (MUTF: RSNRX ). While IENAX carries a Zacks Mutual Fund Rank #2 (Buy), RSNRX carries a Zacks Mutual Fund Rank #3 (Hold) . The other Strong-Buy rank funds in the list are Fidelity Select Materials (MUTF: FSDPX ) and Fidelity Adv Materials A (MUTF: FMFAX ). While both these funds from the Fidelity family has a Strong Buy rank, the top gainer in second quarter Fidelity Select Energy Svcs (MUTF: FSESX ) holds a Zacks Mutual Fund Rank #4 (Sell). Going forward, energy funds will surely be looking to rebound. A downtrend in crude prices helps companies involved in the downstream (refining and marketing). The business of the downstream players is negatively correlated with crude prices. Also, Master Limited Partnerships (MLPs) offered considerable returns at significantly lower risk. Most MLPs are involved in processing and transportation of energy commodities such as natural gas, crude oil, and refined products, under long-term contracts. Original Post

Bullish Banking Earnings Drive Up These ETFs

The financial sector, which accounts for around one-fifth of the S&P 500 index and started off 2015 as an average performer, has set an upbeat tone this earnings season. Several factors including fewer litigation charges, effective cost control measures and modest improvement in core businesses has given Q2 earnings a boost and sent shares to the positive territory. The Zacks Earnings Trend also bears evidence to this burgeoning trend especially on the earnings front. Total earnings for 41.1% of the sector’s total market capitalization (reported so far) are up 11.7% on flattish revenues (down 0.1%) with beat ratios of 68.8% and 50%, respectively. The performance bettered what we saw from this group of Finance sector companies in other recent quarters. Overall, higher investment banking activity thanks to solid deals in the U.S. ranging from mergers and acquisitions to IPOs along with loan growth, sound trading business and cost containment efforts seem to be holding the key to the recent success. Let’s take a look at the big banks’ earnings which released early this week and in the last: Big Bank Earnings in Focus JPMorgan (NYSE: JPM ) reported earnings of $1.54 per share beating the Zacks Consensus Estimate of $1.44 and improving from the year-ago earnings of $1.46. JPMorgan recorded revenues of $24.5 billion, which was marginally ahead the Zacks Consensus Estimate of $24.4 billion. However, the top line compared unfavorably with the year-ago number of $25.3 billion. Wells Fargo (NYSE: WFC ) earned $1.03/share in Q2 which missed the Zacks Consensus Estimate by a penny. However, the reported figure was above the year-ago number $1.01/share. The quarter’s total revenue came in at $21.3 billion, falling short of the Zacks Consensus Estimate of $21.6 billion. But, revenues rose 1% year over year. Goldman (NYSE: GS ) earned $4.75 per share in Q2 (excluding provisions), beating the Zacks Consensus Estimate of $3.70. Net revenue declined 1% year over year to $9.1 billion but surpassed the Zacks Consensus Estimate of $8.8 billion. Morgan Stanley’s (NYSE: MS ) second-quarter adjusted earnings from continuing operations of 79 cents per share surpassed the Zacks Consensus Estimate of 73 cents but fell from the year-ago number of 89 cents. Net revenue (excluding DVA adjustments) surged 12% year over year to $9.6 billion. Moreover, it came ahead of the Zacks Consensus Estimate of $8.97 billion. Citigroup Inc.’s (NYSE: C ) adjusted earnings per share of $1.45 for the quarter outpaced the Zacks Consensus Estimate of $1.35. Further, earnings compared favorably with the year-ago figure of $1.24. Adjusted revenues of Citigroup declined 2% year over year to $19.16 billion. Including credit valuation adjustment (CVA) and debt valuation adjustment (DVA), Citigroup revenues remained relatively stable with the prior-year period at $19.47 billion. However, the revenue figure surpassed the Zacks Consensus Estimate of $19.16 billion. The true star was Bank of America Corporation (NYSE: BAC ) which turned around this season. Its second-quarter earnings of 45 cents per share outdid the Zacks Consensus Estimate of 36 cents and were way above 19 cents gains earned in the prior-year quarter. Net revenue of $22.1 billion was up 2% year over year and beat the Zacks Consensus Estimate of $21.3 billion. ETF Impact Thanks to a spate of pretty decent earnings from banks last week, the related ETFs got a boost. All the aforementioned companies have considerable exposure in funds like iShares U.S. Financial Services ETF (NYSEARCA: IYG ), iShares US Financials ETF (NYSEARCA: IYF ), PowerShares KBW Bank ETF (NYSEARCA: KBWB ), Financial Select Sector SPDR (NYSEARCA: XLF ) and Vanguard Financials ETF (NYSEARCA: VFH ). All these U.S. financial ETFs were in green and returned in the range of 1.1% to 3% in the last five trading sessions (as of July 20, 2015). Sluggish revenues were a drag on the banking earnings scorecard this season thanks to a still-low interest rate environment, which is however likely to tail off sometime later in 2015 as the Fed is preparing for an interest rate lift-off. Original Post

Q2 Earnings Bring No Respite For Oil Service ETFs

The oil price carnage, which started to unsettle the investing world in the second half of 2014, is showing no sign of a retreat. Even this year, the crude issues are blazing. As a result, investors are fervently looking out for the earnings performance of oil service companies to weigh their options for an investment in energy stocks. Presently, the Zacks Industry Rank for oil service companies is in the bottom 27%. Thanks to this outright bearish backdrop, the sector is grabbing investors’ focus this earnings season, as everyone is keen on finding out the direction of oil flow. Let’s delve a little deeper into the earnings picture and see how things are shaping up for the space. In this piece, we have discussed two stocks – namely, Schlumberger Ltd. (NYSE: SLB ) and Halliburton Company (NYSE: HAL ). Between the duo, Schlumberger reported earnings on July 16, followed by Halliburton on July 20. The results were broadly mixed, with Halliburton beating on both lines and Schlumberger delivering mixed numbers. Results in Detail Halliburton, the second-largest oil service company, came up with an earnings and revenue beat in Q2. Its earnings of $0.44 per share from continuing operations beat the Zacks Consensus Estimate of $0.29. However, the bottom line deteriorated from the second-quarter 2014 adjusted earnings of $0.91 per share. The company’s revenues of $5.9 billion reflected a year-over-year decline of 26.5%, but a 0.7% beat over the Zacks Consensus Estimate. Higher profitability in Brazil, improved drilling activities in the Middle East/Asia and cost containment efforts led to the beat, despite the energy sector’s weakness. The shares were up over 1.8% in the key trading session following the results, but the slump in crude prices in the wake of a steadier greenback led the stock to shed 1.6% after-hours. Schlumberger, the world’s largest oilfield services provider, came up with a mixed Q2 with adjusted earnings of $0.88 per share (excluding special items), which edged past the Zacks Consensus Estimate of $0.79, but fell from the year-ago number of $1.37. Total revenue of $9.0 billion declined 25% year-over-year and fell shy of the Zacks Consensus Estimate of $9.1 billion. SLB retreated about 0.4% following its results, mainly reflecting the revenue weakness and failing crude prices. Market Impact The space is obviously woebegone. Still, a bottom-line beat in both firms in this downbeat operating environment can be perceived positively. While a single stock pick is always an option to play this earnings season, we could see a deep impact on ETFs that are heavily invested in these popular oil service companies (see all the Energy Equity ETFs here ). Notably, the ETF route will help investors to mitigate one company’s average performance with the other company’s stellar results. Below, we have highlighted three oil-services ETFs with considerable allocation to SLB and HAL that could be in focus following oil-service earnings: iShares U.S. Oil Equipment & Services ETF (NYSEARCA: IEZ ) This ETF, which tracks the Dow Jones U.S. Select Oil Equipment & Services Index, invests about $313 million of assets in 46 securities, focusing solely on the energy world. In-focus SLB takes the first position here, with 23.83% of holdings. Generally, when one stock accounts for as much as 23% of an ETF’s weight, its individual performance decides much of the fund’s price movement. HAL takes up the second position, with about 10.22% of total assets. The fund is off about 11.5% year-to-date (as of July 20, 2015). However, following the release of earnings by the duo, IEZ has lost about 2.4% (as of July 20, 2015). IEZ is a cheaper fund, charging 0.44% for its expense ratio. The fund has a Zacks ETF Rank #3 (Hold), with a High risk outlook. Market Vectors Oil Services ETF (NYSEARCA: OIH ) OIH tracks the Market Vectors US Listed Oil Services 25 Index. The index invests $986.7 million of assets in 26 holdings. The fund devotes as much as 22.28% of the portfolio weight to SLB, followed by 13.2% in HAL. OIH is cheap in the space, with an expense ratio of 0.35% (read: Oil Services ETFs Head-to-Head: XES vs. OIH ). The fund is down about 11.3% so far this year (as of July 20, 2015), and has lost about 2.4% since July16. OIH has a Zacks ETF Rank #3, with a High risk outlook. PowerShares Dynamic Oil & Gas Services Portfolio ETF (NYSEARCA: PXJ ) This product offers exposure to 30 energy stocks, with SLB and HAL at the second and fourth positions, respectively, allocating more than 5% of total asset to each. PXJ tracks the Dynamic Oil & Gas Services Intellidex Index, and has amassed about $58 million thus far. The ETF charges 61 bps in fees. Thus, it is slightly more expensive than some of its counterparts. The fund has lost about 3.3% following the earnings release of the two companies, and is off over 15% year-to-date. PXJ has a Zacks ETF Rank #4 (Sell), with a High risk outlook. Original Post