Tag Archives: stocks

The Emerald Economy

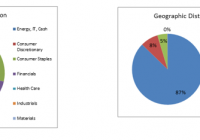
Ireland has the top growth rate in the EU. Ireland has an extraordinarily friendly business environment. EIRL one of the few ways to invest the Irish economy. The approval of the referendums in Northern Ireland and the Republic of Ireland on May 22, 1998 was the culmination of a long and arduous peace process, putting an end to the troubles which had plagued the region for countless decades. Once free of strife, Ireland began to restructure and develop a modern economy. Ireland has been an EU member since 1973 and Eurozone member since 1999. Ireland focused on building a ‘knowledge economy’, attracting foreign investment in technology, services and trade earning it the name ‘Celtic Tiger’. Unfortunately, and not unlike most advanced economies, Ireland suffered a severe banking crisis after the collapse of inflated property and credit markets in 2008. It became necessary for Ireland to apply for over $70 billion in IMF and ECB bailout loans. After years of austerity and restructuring, Ireland became the first Eurozone nation to exit the EU-IMF rescue program in 2013. The Emerald Island’s economy has since recovered to become the fastest growing economies in the EU, measuring a 4.8% pace in 2014 after a mere 0.2% in 2013. To put this in perspective the EU as a whole managed 0.8% GDP growth in 2014. It seems then that there exists a unique opportunity here, for an investor seeking to diversify a portfolio by careful selection of regional economies. Of over 70 ETFs filtered from using the Global/International Equities/Europe filter of the Seeking Alpha ETF Hub , only one specifically focuses on Ireland: the iShares MSCI Ireland Capped ETF (NYSEARCA: EIRL ) . According to the prospectus , its objective is to track the investment results of a broad based index, the MSCI 25/50 Ireland Capped Index, composed of mid, small and large cap Irish equities. The fund is passively managed. The MSCI 25/50 index capping methodology requires that no more than 25% of the fund’s assets are invested in a single issuer and that the sum of the weights of all issuers representing more than 5% of the fund should not exceed 50% of total assets. The fund itself is not large with 25 companies plus a cash position. The largest sector holdings are in Materials and Consumer Staples followed by Industrials and Financials and lastly Health Care and Consumer Discretionary. The combined Energy, IT and cash positions account for only 0.2816% of holdings. The fund is biased towards growth with over 65% of the portfolio invested in cyclic or cyclically sensitive sectors. (click to enlarge) (Data from iShares) Of fund’s ten heaviest weighted sectors, Materials account for about 36%; Industrials for 17%; Financials for 14% and Consumer Discretionary for 6%. This is somewhat offset defensively having Consumer Staples account for 21% and Health Care for 6%. Hence the fund has a strong cyclically sensitive bias among its heaviest weighted components, as well. (Data from iShares) Ireland’s consecutive yearly trade surplus demonstrates the importance of trade to the Emerald economy. Hence, the investor should take note of the major exports as well as major export partners. Ireland is global leader as a supplier of pharmaceuticals. In fact, over 50% of Ireland’s exports are pharmaceuticals, compounds, medical supplies or medical instruments. Ireland’s top trading partners are EU members, with the exception of Switzerland, Japan and the United States. (click to enlarge) In 2013, Forbes ranked Ireland number one in its list of best countries to establish business in out of 145 nations. Ireland’s main global attraction is its 12.5% corporate tax rate, pulling in major US high tech firm such as Google (NASDAQ: GOOG ), Amazon (NASDAQ: AMZN ), eBay (NASDAQ: EBAY ), LinkedIn (NYSE: LNKD ) and Facebook (NASDAQ: FB ). The list is just as impressive for the Pharmaceutical and Bio Tech giants such as Abbot Labs (NYSE: ABT ), Pfizer (NYSE: PFE ), Boston Scientific (NYSE: BSX ), Glaxo-Smith-Kline (NYSE: GSK ) and Allergan (NYSE: AGN ). (click to enlarge) (Data from iShares) The point of the matter is, Ireland’s success in transitioning from a strife torn agricultural economy into a globally leading knowledge economy was the result of sacrifice, compromise and a healthy dose of extremely innovative thinking. The investor should note that Ireland is a small economy, but nimble, thus maintains the ability to adjust, adapt and grow rapidly, as it has already proven with a 4.8% growth rate while global super-economies struggle with quantitative easing, high taxes and ‘new-normal’ growth rates. Hence, it is not unreasonable to conclude that as the US, and EU economies continue to recover over the next several years, it will bode well for the Irish economy. As mentioned, the fund has 25 holdings with net assets totaling $110,957,731 and trades on the NYSE under the symbol EIRL. The fund was launched in May of 2010. Some key facts are summarized in the table of the top ten holdings below: Key Facts: Number of Holdings Outstanding Shares Net Assets 20 Day Average Volume P/E Beta 12 Month Trailing Yield Premium/Discount Expense Ratio 25 2.8 million $110, 957,731 12,463 21.92 1.22 1.59% 1.12% 0.47% Top Ten Holding Summary: Company Sector Dividend Payout Ratio Beta EPS (Est.) P/E (NYSE: TTM ) Price/Cash Flow Market Cap (NYSE: MILL ) CRH ( OTCPK:CRHCF ) Materials 2.32% 79.04 1.46 0.79 34.17 17.63 $24,315 Kerry Group ( OTCPK:KRYAY ) Consumer Staples 0.65% 4.96 0.57 2.73 25.57 20.05 $13,486 Bank of Ireland (NYSE: IRE ) Financial 0.00% 0.00 2.97 0.02 18.56 15.79 $13,251 KingSpan Group ( OTC:KGSPY ) Materials 0.73% 26.03 0.90 0.61 36.52 25.97 $4,347 Glanbia ( OTCPK:GLAPY ) Consumer Staples 0.57% 22.21 0.64 0.49 38.86 28.10 $6,241 Icon (NASDAQ: ICLR ) Health Care 0.00 0.00 0.84 3.07 22.22 16.53 $4,539 Paddy Power ( OTCPK:PDYPD ) Consumer Discretionary 2.06% 51.41 0.35 2.97 27.58 18.72 $3,972 SMURFIT KAPPA GRP ( OTCPK:SMFKY ) Materials 1.98% 37.51 2.01 1.06 26.33 10.53 $7201 RYANAIR (NASDAQ: RYAAY ) Industrials 0.00% 0.00 0.96 3.38 21.74 13.73 $18,496 Grafton Group ( OTCPK:GROUY ) Industrials 1.17% 31.23 1.63 0.34 21.61 15.24 $1886 Averages 0.948% 25.239 0.579 1.233 27.316 18.229 $9773.4 (Data from Reuters) To be sure, there is a risk involved when investing in a smaller country focused ETF which is closely tied in with superpower economies. However, Ireland seems to have been extraordinarily successful at attracting fixed capital investment particularly of global corporate giants. (click to enlarge) (Data from iShares) Lastly, this is a lightly traded ETF, averaging fewer than 12,500 shares per trading session over 20 days. Below is a price chart with dividends. Hence, the iShares MSCI Ireland Capped ETF offers investors one of the few, if not the only way to invest in Ireland’s surprisingly fast growing economy, through a mostly unnoticed ETF. Disclosure: I/we have no positions in any stocks mentioned, and no plans to initiate any positions within the next 72 hours. (More…) I wrote this article myself, and it expresses my own opinions. I am not receiving compensation for it (other than from Seeking Alpha). I have no business relationship with any company whose stock is mentioned in this article. Additional disclosure: CFDs, spreadbetting and FX can result in losses exceeding your initial deposit. They are not suitable for everyone, so please ensure you understand the risks. Seek independent financial advice if necessary. Nothing in this article should be considered a personal recommendation. It does not account for your personal circumstances or appetite for risk.
Pursuing Smart Beta: Multi-Factored ETFs

Summary Both iShares and Global X have recently issued ETFs based on selecting holdings using complex systems of implementing “smart beta.” iShares’ “FactorSelect” funds use a complex system of factors to select high-quality holdings. Global X’s “Scientific Beta” funds use a complex weighting system to develop a portfolio that will perform optimally. In June, I wrote about the iShares FactorSelect MSCI International ETF (NYSEARCA: INTF ), an ETF with an inception date of April 28, 2015. 1 iShares introduced four other funds on that same date: the iShares FactorSelect MSCI Intl Small-Cap ETF (NYSEARCA: ISCF ), the iShares FactorSelect MSCI Global ETF (NYSEARCA: ACWF ), the iShares FactorSelect MSCI USA ETF (NYSEARCA: LRGF ) and the iShares FactorSelect MSCI USA Small-Cap ETF (NYSEARCA: SMLF ); as the names would suggest, all of the funds have something in common: they are based on the FactorSelect strategy. Shortly after the iShares releases (May 12, to be exact), Global X Funds issued four ETFs of its own: the Global X Scientific Beta U.S. ETF (NYSEARCA: SCIU ), the Global X Scientific Beta Europe ETF (NYSEARCA: SCID ), the Global X Scientific Beta Asia ex-Japan ETF (NYSEARCA: SCIX ), and the Global X Scientific Beta Japan ETF (NYSEARCA: SCIJ ). Again, as the names suggest, all four ETFs are based on the same ( Scientific Beta ) strategy. Both series of funds represent efforts by their respective issuers to provide investors with a “bridge” between – or perhaps better: an alternative to – actively managed funds and purely passive funds. 2 I thought it might be interesting to take a look at the two sets of offerings and their underlying strategies; there are interesting similarities between the approaches, as well as some significant differences. FactorSelect BlackRock’s (NYSE: BLK ) approach to Smart Beta involves a (proprietary) model that selects companies for a given fund on the basis of four factors: 3 Value : a score is derived from a company’s valuation, using measures such as price/book value, forward share price to earnings, enterprise value to operating cash flow, etc. Quality : a score is computed using a company’s metrics (return on equity, debt/equity, earnings variability, etc.). Momentum : the score is a composite of the security’s relative performance against the global market (for two years), and against securities based in the same country (for six months and twelve months). Low Size : the score is a measure of a company’s market capitalization compared to companies based in the same country. The final score is a composite of the four factors, which are modified-capitalization weighted. The funds are rebalanced/reconstituted semi-annually. Scientific Beta As with BlackRock, Global scores its potential holdings on the basis of four factors, although each factor has a single definition, rather than being an aggregate of several “sub-factors.” 4 , 5 Thus: Value : Price to Book Size : Market Capitalization Low Volatility : 104-week historical volatility Momentum : last 52-week total return, excluding most recent month. Unlike BlackRock’s modified-cap-weighting scheme for its factors, Global employs a more complex weighting system incorporating five schemes: 6 Maximum Deconcentration : equal weights to minimize firm-specific risk. Maximum Decorrelation : minimizes volatility based on historical correlations between holdings. Diversified Risk Weighted : volatility and weight are inversely correlated (greater volatility gets lesser weight) Efficient Minimum Volatility : minimize portfolio volatility based on both correlations and volatilities. Efficient Maximum Sharpe Ratio : maximize risk-adjusted performance based on expected returns and volatilities. The funds are rebalanced/reconstituted quarterly. Comparison In essence, both sets of funds mimic an actively managed fund by introducing complex selection and weighting criteria. The use of complex criteria adds a discretionary element to holdings selection, while at the same time providing the same level of transparency that is typical of an index fund. The difference between the two sets of holdings is in the focus of the complexity they introduce, with iShares introducing the complexity in the scoring factors and Global using a complex weighting schema. I will argue that while their approaches are different, the results may – at least intuitively – be quite similar. 7 Factors Both sets of funds look at a company’s size , value and momentum . Where they differ, iShares factor involves data reflecting a company’s quality , while Global factors the volatility of a company’s stock. But even where the two series “agree,” the agreement is in name only. Global defines its factors very narrowly, choosing a single characteristic, ratio or formula for each factor, while the iShares funds’ factors are complex aggregates. The difference in factor composition is perhaps most starkly exhibited in terms of stock value . It is difficult to accept that one can determine the valuation of a company on a single metric, particularly price-to-book. 8 Finding a realistic way to combine a set of valuation data to arrive at a reasonable value seems more adequate. Both funds incorporate size in their factoring, where they seek to avoid selecting large companies. Statistically, smaller companies realize more growth than large companies do, so in the interest of maximizing portfolio growth potential both fund series place greater value on the smaller companies. It is with regard to size that both companies structure their portfolios differently. iShares divides its FactorSelect funds according to U.S., ex-U.S. Developed, and Global focuses, with the first two subdivided between large- and mid-cap portfolios on the one hand, and small cap portfolios on the other. Global structures its four portfolios to include all market caps in each. Momentum is an interesting case, with Global focusing on a company’s total returns over 52 weeks, while iShares considers a company’s performance in relation to ((a)) global stocks over two years, and ((b)) same-country companies over six- and 12- month periods. Thus, while Global is looking at each company individually, iShares evaluates companies in the context of global and national trends – a more dynamic picture of how well a company is doing. I must admit to a little dismay that Global does not take fundamentals into account. One of iShares’ factors (quality) is essentially a composite of a company’s fundamental data, and would seem to be (at least to my view) much more important in evaluating a company’s prospects than low volatility, which replaces fundamentals in the Global schema. Moreover, and as we will see next, volatility plays an important role in Global’s weighting schema – using it in two phases of its selection process would seem excessive to its overall importance. Weighting Comparison While iShares’ factors are complex aggregates, the series becomes somewhat one dimensional in terms of its weighting system, which is a “modified market-cap weighting,” the weight a holding receives being its capitalization influenced by its overall factor score. Global’s factors may be one dimensional, but its weighting system is decidedly not. Global’s five-element weighting process is designed to identify correlations and volatilities in its portfolio, adjusting the weighting of its holdings (from an initial equalized weighting) to compensate for intra-portfolio correlations and minimize overall portfolio volatility. Finally, weighting is adjusted according to the companies’ Sharpe Ratios. Assessment In general, the primary difference between the two sets of funds seems to be that the iShares FactorSelect funds have portfolios that are constituted very selectively, while the Global X Scientific Beta funds have portfolios that are balanced for optimal performance. It will be interesting to see which series fares better over time from this perspective, but I do not see enough significance in this difference to recommend one series over the other. 9 Both systems are crafted to produce a portfolio that should exhibit excellent growth patterns, although they accomplish that goal differently. What is significant is the focus of each fund in both series. Global has developed funds that are geographically specific – one for the U.S., one for Europe, one for Japan and one for “non-Japan” Asia. If the investor is interested in a nicely balanced portfolio for a specific region, the Scientific Beta series makes for an attractive option. The iShares funds, on the other hand, constitute very selective groups of companies that provide excellent growth potential – at least, in principle. The funds are differentiated according to the extent of that potential: the relative safety of mid- to large-capped holdings or the greater potential growth of small caps; they are further differentiated by whether the holdings are domestic or international. The investor is choosing an equity category only broadly differentiated regionally. As I mentioned in my article on INTF, I have been really reluctant to commit to an international ETF. INTF is the first fund that has appealed to me in terms of its selectiveness and the range of its holdings. The fund has enabled me to add solid international holdings to my portfolio while making me feel confident that the foreign holdings are high quality companies with good growth prospects. Disclaimers This article is for informational use only. It is not intended as a recommendation or inducement to purchase or sell any financial instrument issued by or pertaining to any company or fund mentioned or described herein. All data contained herein is accurate to the best of my ability to ascertain, and is drawn from the Company’s Prospectus, Statement of Additional Information, and fact sheets. Data from any other sources (if used) is cited as such. All opinions contained herein are mine unless otherwise indicated. The opinions of others that may be included are identified as such and do not necessarily reflect my own views. Before investing, readers are reminded that they are responsible for performing their own due diligence; they are also reminded that it is possible to lose part or all of their invested money. Please invest carefully. 1 ” INTF: An Ideal Basket Of International Equities ,” Seeking Alpha , June 9, 2015. 2 Both companies specify that their strategies are intended to provide viable alternatives to actively managed funds while outperforming the simple indexed funds. 3 These factors are described in detail in the prospectuses(under “Principal Investment Strategies”) for each of the funds. All five funds apply the same factors, each fund applying them to a specific regions/market capitalization. The calculations in the model are proprietary to MSCI, which develops the underlying index for the funds. 4 Global X Scientific Beta ETFs Family Guide , available here . 5 A detailed discussion of the construction of the indices used by Global X can be found in ERI Scientific Beta Equity Strategy Construction Rules , by the EDHEC-Risk Institute . 6 Scientific Beta ETFs Family Guide . 7 Similar, at least, in terms of ultimate approach, although not necessarily in terms of actual portfolio content. 8 I am a big fan of price-to-book value. It is a great indicator of value, and I regularly look at companies that have P/Bs less than 1 – these are companies where the value of the actual assets of the company exceed the value of the shares. In the event of a bankruptcy, shareholders of such a company would, in principle, receive more money for their shares than they paid. However, I would not rely on P/B as the determinant of a company’s overall value. 9 Actually, I do, but it is a matter of personal preference, rather than rigorous analysis. The FactorSelect process seems more comprehensive, indicating a greater level of sensitivity to the strength (both fundamental and displayed) of the companies of which the portfolio is comprised, while the Global X Scientific Beta system – while rich in its weighting system – seems rather sparse in selectiveness. The result of the latter system is a portfolio that may be well-balanced, but I am less confident in the components of that portfolio. Disclosure: I am/we are long INTF. (More…) I wrote this article myself, and it expresses my own opinions. I am not receiving compensation for it (other than from Seeking Alpha). I have no business relationship with any company whose stock is mentioned in this article.

Is UNG About To Rally Anytime Soon?

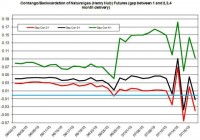
The natural gas market remains soft despite the rise in demand for the commodity in the power sector. The Backwardation continues to keep UNG below the price of natural gas. The storage is expected to further rise at a faster than normal pace, which could keep down UNG. Despite the ongoing weakness in the energy market, the United States Natural Gas (NYSEARCA: UNG ) remained relatively flat in the past month at around the $13 mark. The price of the Henry Hub is still in the $2.7-$2.8 range and has yet to show any signs of recovery. Even the hotter than normal temperatures that is driving up the demand for natural gas in the electric power sector hasn’t pulled up the price of UNG. When it comes to the latest developments in the futures markets, the Contango for the four-month delivery has started to pick up, as you can see in the chart below. (click to enlarge) Source of data taken from EIA Nonetheless, the near-term futures are still, for the most part, in Backwardation. This finding suggests the Backwardation in the futures markets, for now, will keep UNG underperforming the price of the Henry Hub: During the past couple of months, UNG rose by only 3.7%; the Henry Hub rose by 5%. It could take a while before we see UNG rising again to pass the $15 mark. One factor that could move the price of UNG is the levels of storage. As of last week, the storage rose by only 61 Bcf – this was 9 Bcf lower than market expectations . The demand for natural gas grew in the power sector, which reduced the injections to storage. And the supply slipped by 0.9% mostly due to lower production – a drop of 1%, week over week. The production is still up for the year by 4%, but this growth rate is lower than in previous months. Perhaps the low rig count has started to impede the progress in the production of natural gas. Based on the latest Baker Hughes report, the number of rigs fell to 216. Despite the lower growth rate in production and falling number of rigs, the Energy Information Administration still projects the natural gas output will rise by 5.7% this year and 2% in 2016. Furthermore, according to the recent Energy Information Administration monthly update, the storage is expected to rise at a faster than normal pace and bring the storage to 3,919 Bcf by the end of October – the expected end of the injection season. This storage level will be 3.2% higher than the 5-year average. Based on this outlook, the EIA estimates the injections to storage will remain, on average, 5% higher than the 5-year average. (click to enlarge) Source of data taken from EIA and Author’s calculations For the next few weeks, the injections to storage are expected to be only slightly higher than normal, in part, due to the rise in demand in the power sector. The weather is expected to be much warmer than normal throughout the South and West Coast, but colder than normal in the Northeast and Midwest. The potential rise in demand in the electric sector is also supported by the projected higher than normal cooling degree days : They are estimated to be 23 degrees higher than normal this week. The rise in demand in the power sector hasn’t been enough to pull up the price of UNG so far this year. The production has started to slow down, which could help tighten the natural gas market. But if the weather keeps heating up, production eases down, and injections to storage remain stable, these factors could start to slowly push back up the price of UNG. Nonetheless, UNG is still likely to remain at its low level in the near term. For more see: Natural Gas is Still Floating… Barely . Disclosure: I/we have no positions in any stocks mentioned, and no plans to initiate any positions within the next 72 hours. (More…) I wrote this article myself, and it expresses my own opinions. I am not receiving compensation for it (other than from Seeking Alpha). I have no business relationship with any company whose stock is mentioned in this article.