Tag Archives: stocks

Stock Market Genius Made Easy: Spinoffs
Summary Empirical evidence would suggest spinoffs outperform the market. Prior research gives us a rough guide to investing in them. You can simplify the process with online tools and/or an ETF. More than 15 years ago, Joel Greenblatt wrote his masterpiece: You can be a stock market genius. Several other contributors here on Seeking Alpha have sung the book praises. I will be brief: If you haven’t read it, do so. (You could even read it for free by signing up for a free month at Scribd ) Among the strategies Greenblatt discusses, investing in spinoff stocks is one of them. A spinoff is when a company takes a division and separates it, creating a free standalone company. The strategy still works, however, the book was written 15 years ago. In this article, I will: Review briefly the papers proving empirical evidence that spinoff stocks tend to outperform. Rehash a few of Greenblatt’s pointers. Explore tools and strategies, which can simplify the process in 2015. The Empirical Evidence A while ago, John Mcconnell and Alexei Ovtchinnikov wrote a paper studying stocks of both parents and subsidiaries straight after a spinoff occurred between 1965 and 2000. They took the approach of buying the stocks straight after the spinoff and holding them for 36 months. They then computed excess returns in comparison with each stock’s industry, and with stocks with similar size. The results were impressive: The subsidiaries generated substantial ex-post alpha, especially within the first two years of holding the stocks. Source: Predictability Of Long Term Spinoff Returns Even after having adjusted the returns to a Fama-French-Carhart four-factor model, the sample still generated ex-post alpha. If you are interested in the nitty gritty details, I strongly suggest you read the paper. Here are a few points concerning the economic reasoning behind spinoff outperformance: Initial overselling of the security: Following a spinoff, the stock tends to be oversold as institutions which are unable to hold the stock for various reasons (They require dividend-paying stocks, they can’t invest in small caps, etc.) sell the stock. Many individual investors might also sell the spinoff because they want to be invested in the parent only. This depressed price creates an opportunity to find value. Better allocation of resources: Splitting a company into two entities allows each company to focus on creating value through their independent businesses. The destruction of the conglomerate discount: It is a well-known fact that the stock market tends to undervalue conglomerates because of the added complexity in analyzing them. Separating entities often creates pure play stocks in two different businesses. It can therefore be expected that this discount corrects within the first years after a spinoff. Or as Mr. Greenblatt says “Sometimes, Capitalism works” : In other words making the managers of each individual company more responsible, more accountable, and more directly incentivized, often plays out nicely. Greenblatt’s Strategy Throughout his career, Greenblatt has used this market inefficiency for personal gain. In his book, he recounts a few reasons why companies spinoff divisions, other than the obvious “to be better appreciated by the market”: To separate a “bad” business, so that the “good” one can show more of its value. Often they might leave the bad business with massive amounts of debt which can create a leveraged bet, for better or for worse. To create value for investors when a business can’t be sold as a whole, at least not at a reasonable price. To avoid being taxed on the sale of the business. Spinoffs are not taxed when the shares are distributed to the shareholders of the parent company. He also gives a rough hand guide to finding interesting spinoff opportunities: Read the WSJ looking out for upcoming spinoffs. (Don’t worry we’re in 2015 now, it needn’t be that hard, more on that later) Once you’ve found an upcoming spinoff, get your hands on the Form 10 also called general form for registration of securities, and look for some of these cues: Institutions don’t want the spinoff. Questions to ask are: Which current institutions hold the stock? What is their mandate? Are they going to be obliged to sell the spinoff? Insiders want it. Here the focus is on management incentives, including stock options. The idea behind these is that they make managers act like shareholders. There has been quite a debate concerning the effectiveness of such options but when combined with the right elements, they should work. Questions to ask are: Are managers going to be compensated with options? How far out of the money are these options? (Far enough is what you are looking for) Who is going to manage the company? How is management talking about the spinoff? (Watch out they may be talking it down to depress the price) Is what they are saying congruent with their various incentives? If not why not? Finally, usual fundamental analysis must be conducted . Questions to ask are: Is a great stock at a cheap price being uncovered? Has a leveraged bet with an interesting risk/return profile been created? Tools And Strategies in 2015 The economic reasoning for spinoff outperformance seems sound, and the empirical evidence of ex-post alpha is robust. If investors can generate alpha through investing in spinoffs what tools and strategies can they use today to simplify the process? Remember, how I mentioned you didn’t need to read the WSJ every day to find spinoff opportunities? As you might have guessed there is now a website on which you can find all upcoming spinoffs as well as all recent spinoffs . It’s a valuable tool which can be used to find interesting opportunities. Granted, you still need to do the hard work of looking up companies and picking your spots, but at least it is a lot easier. Source: Stockspinoffs.com As you can see, they even named it appropriately. I do want to disclose that I have no business with the website, and am only sharing because it’s an interesting tool. It is also useful to use it to see how spinoffs have performed over time. I will use this tool as a warning. NAME data by YCharts I picked three stocks randomly which spun off in August last year. As you can see these stocks aren’t a promise for riches, and investors should keep that in mind. You can’t just throw darts at a list to pick your spinoffs. You have to do the hard work. Or… you can invest in a quant spinoff ETF. Guggenheim Spin-Off ETF (NYSEARCA: CSD ) The Guggenheim Spin-off ETF seeks to reproduce the returns of the Beacon Spinoff Index before fees which will set you back 0.66% a year. The fund is constructed very similarly with weights changing only modestly. Here is a peak at CSD’s top 20 holdings vs. the index. These account for over 75% of the portfolio in both cases. Source: Guggenheim Investments What is interesting is how this index is constructed. Potential Index constituents include all equities trading on major U.S. exchanges of companies that were spun-off during the two year period beginning 30 months prior to reconstitution and ending 6 months prior to reconstitution. This time frame may be extended to compensate for periods where there are too few new spinoffs to populate the index. The Spin-off Index is comprised of up to of the 40 highest-ranking stocks chosen from the universe of spun-off companies. Each company is ranked using a 100% quantitative rules-based methodology that includes composite scoring of several growth-oriented, multi-factor filters, and is sorted from highest to lowest. Up to 40 stocks are chosen and given a modified market cap weighting with a maximum weight of 4.5%. The constituent selection process and portfolio rebalance is repeated semi-annually, however, if there are not enough new Spin-offs to populate the index, a rebalance may be delayed. What this means is that you will own stocks at the earliest 6 months after they have spun off, and they will be removed at most 36 months after the spinoff (Selection process happens semiannually, and stocks can be included if spun off up to 30 months prior to constituent selection). I have not found any information about their so called rule based ranking. Whether this ranking generates value or not might be questionable, but it can’t be worse than simply ranking stocks by market cap, can it? The index gives each of its 40 stocks a maximum weight of 4.5% whereas CSD weights stocks as high as 5%. So here you go, a no hassle, sleep well at night way to get exposure to spinoffs and their inherent inefficiencies through the first years. How has it performed? This year just as bad as the overall market, over time, a lot better. CSD data by YCharts CSD data by YCharts I will be allocating money towards the CSD ETF as soon as the next transfer makes it to my trading account. Conclusion Spinoffs have beaten the market. Empirical evidence proves it. Sound economic reasoning would suggest they might continue to do so. Great results can be attained by picking your spots. You’ll probably do okay with passive exposure. Disclosure: I/we have no positions in any stocks mentioned, but may initiate a long position in CSD over the next 72 hours. (More…) I wrote this article myself, and it expresses my own opinions. I am not receiving compensation for it (other than from Seeking Alpha). I have no business relationship with any company whose stock is mentioned in this article.

Low Volatility Anomaly: Buffett’s Alpha Example

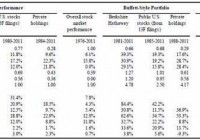
Summary This series offers an expansive look at the Low Volatility Anomaly, or why lower risk stocks have historically produced stronger risk-adjusted returns than higher risk stocks or the broader market. This article offers empirical evidence that one of the most successful investment minds of a generation has capitalized on this anomaly. By adding financial leverage to lower risk businesses, Berkshire Hathaway has generated higher risk-adjusted returns historically. Given the long-run structural alpha generated by low volatility strategies, I wanted to dedicate a more detailed discussion of the efficacy of this style of investing for Seeking Alpha readers. In recent articles, I have provided readers a detailed theoretical underpinning of the strategy. In this article and subsequent pieces, I am going to provide empirical evidence across markets that depicts the success of a low volatility bent. Empirical Evidence of the Low Volatility Anomaly Since the evolution of the Capital Asset Pricing Model (CAPM) in the early 1960s, it has been axiomatic in modern finance that expected returns are a function of an asset’s systematic risk, or beta, when the asset is added to a well-diversified portfolio. As discussed throughout this series thus far, the simplifying assumptions underlying CAPM provide frictions between model and market. These conventions underlying CAPM include that markets are wholly efficient, investors can lend and borrow unlimited amounts at the risk-free rate, trade fee of transaction costs and tax implications, and that the variance of returns is an adequate measure of risk in a world where asset returns are not normally distributed. Despite these shortcomings, the general CAPM framework has largely become broadly embedded in capital budgeting and, in part, market expectations. The presentation of empirical evidence on the Low Volatility Anomaly is greatly strengthened when you can demonstrate its role in the success of one of the greatest investors of our time. In 2013, Andrea Frazzini, David Kabiller, and Lasse Pedersen, each affiliated with hedge fund AQR Capital Management, published ” Buffett’s Alpha “, which deconstructed the return profile of Berkshire Hathaway (NYSE: BRK.A ) (NYSE: BRK.B ). From their analysis, the authors found: “the general tendency of high-quality, safe, and cheap stocks to outperform can explain much of Buffett’s performance and controlling for these factors makes Buffett’s alpha statistically insignificant.” That is a powerful statement. In a set-up to their attention-grabbing assertion, the authors demonstrated that of all stocks that traded for more than 30 years between 1926 and 2011, Berkshire Hathaway had the highest Sharpe Ratio. Buffett also magnified these risk-adjusted excess returns through the deployment of leverage estimated by the authors to be at a level of 1.6 to 1 on average. The leverage came both in the form of borrowings, which benefited from Berkshire Hathaway’s very high quality credit rating, and through float from his insurance subsidiaries. To demonstrate that Buffet’s tremendous performance was a function of this tendency to buy low risk stocks and employ conservative levels of investment leverage, the authors created tracking portfolios to mimic Buffett’s market exposure and active stock-selection themes, leveraged to the same active risk as Berkshire Hathaway. (click to enlarge) The Buffett-tracking portfolio performs comparably to the best-in-class performance of Berkshire Hathaway, demonstrating that Buffett is less a sage stock picker than a principled practitioner who has long understood the Low Volatility Anomaly and who had an investment vehicle that allowed him to avoid costly liquidations in times of stress. Note that Buffett’s average beta of his public stock holdings was just 0.77. In addition to the impressive long-run alpha demonstrated by Buffett’s leveraging of low volatility assets, another glaring failure of CAPM can be seen in the returns of the S&P 500 Low Volatility Index and the S&P 500 High Beta Index. These two indices form portfolios of the one hundred highest and lowest volatility stocks in the S&P 500 Index based on the standard deviation of price changes of the trailing 252 trading days. The indices are then rebalanced quarterly. The performance of these strategies was backtested to 1990, and demonstrates that returns would have been directionally opposite of what would be predicted by CAPM with low volatility stocks (replicated by the PowerShares S&P 500 Low Volatility Portfolio ETF (NYSEARCA: SPLV )) strongly outperforming high beta stocks (replicated by the PowerShares S&P 500 High Beta Portfolio ETF (NYSEARCA: SPHB )). (click to enlarge) Source: Standard and Poor’s; Bloomberg Joining these two examples, Buffett’s recent notable purchases have conformed to the idea of levering low volatility equities. When Berkshire Hathaway and 3G Capital combined to purchase H.J. Heinz in February 2013 , Heinz was the fifteenth largest constituent in the S&P 500 Low Volatility Index, putting the company in the 97th percentile of the S&P 500 in terms of trailing realized volatility. Buffett’s initial investment included an $8B preferred stake with a high fixed coupon, further dampening the volatility of the cash flow returns his enterprise received as part of the deal. The Berkshire/3G Capital combination would further expand their bet on the low beta packaged food sector in March 2015 with the purchase of a controlling stake in Kraft Foods Group (NASDAQ: KHC ). When Berkshire Hathaway’s Mid-American Energy unit purchased NV Energy in June of 2013 , the stock had a trailing twelve month beta of 0.73 and electric utilities were the largest individual sector weighting of the S&P 500 Low Volatility Index. When Berkshire’s utility unit had made an early purchase of Pacificorp in 2006, it was reported in Electric Utility Week that Buffett told Oregon regulators that owning utilities was “not a way to get rich – it’s a way to stay rich.” This quote came in the two years following Texas Pacific’s failed bid for Oregon’s Portland General Electric (NYSE: POR ) and KKR’s nixed acquisition of Arizona’s Unisource ( OTCPK:USRC ). Regulators at the time were concerned that these private equity firms would purchase the utility holding companies with excessive financing, the cost of which could be explicitly borne by customers in the form of higher rates and implicitly through backlogged maintenance, as capital expenditures were crowded out by debt service payments. With the notable exception of the disastrous TXU leveraged buyout in 2007, the industry has largely eschewed large scale leveraging transactions in favor of incremental releveraging through conservatively financed share repurchase plans and above market dividend rates. With regulated returns on equity, utilities generate stable and predictable cash flows for strong operators, making Buffett’s desire to lever the cash flow streams of these companies highly consistent with his long established track record of buying stable businesses. Warren Buffett’s tremendous long-run performance is in large part attributable to his early understanding of the relative outperformance of lower risk and stable businesses. In my next article in this series, I will demonstrate a way to capitalize on the Low Volatility Anomaly in the fixed income market. Disclaimer My articles may contain statements and projections that are forward-looking in nature, and therefore inherently subject to numerous risks, uncertainties and assumptions. While my articles focus on generating long-term risk-adjusted returns, investment decisions necessarily involve the risk of loss of principal. Individual investor circumstances vary significantly, and information gleaned from my articles should be applied to your own unique investment situation, objectives, risk tolerance, and investment horizon. Disclosure: I am/we are long SPLV. (More…) I wrote this article myself, and it expresses my own opinions. I am not receiving compensation for it (other than from Seeking Alpha). I have no business relationship with any company whose stock is mentioned in this article.

Risk? What Risk?

By Dominique Dassault Equity Risk Is Increasingly Non-Existent… By The Numbers The concept of risk for hedge fund managers is a constant concern. The internal monologue goes something like this…”what’s my downside if I initiate this position… how much can I lose if I am not right?” The real answer is that you really have no idea… despite best efforts… even with stop losses [which I abhor]. The true, measurable risk of any position is only exactly known after you liquidate the position. Plus, risk management is more capital management than single stock management. Little did he know how it would all end… Cartoon via wallstreetsurvivor.com How much capital are you assigning to each position in the context of the entire portfolio capital? And are your different positions correlated or not? Even if they are [not], historically, there is no guarantee that correlation [or not] will continue. Anyway… back to risk. Every day my prime broker blasts me with a report loaded with scores of trading metrics calculated over many time frames [mostly the last twelve months]. It is all very interesting but the only real metrics I care to focus on are total returns and risk-adjusted returns. Most clients could not care less about risk-adjusted returns… but I sure do. And, as many are aware, the holy grail of risk metrics is the Sharpe Ratio [as calculated according to the title of this post]. The most interesting precept of the Sharpe Ratio, in my opinion, is that it treats volatility as random… both upside and downside volatility. No way to predict it in either direction so both directions are assigned the same discounting value. Basically, according to Bill Sharpe, all volatility is a penalty against your performance. I get it. Still, in a perfect world, what if most of the volatility experienced by a portfolio of equities was actually favorable? So rare… if not impossible… but still at least worthy of consideration. And so the Sortino Ratio [or as I refer to it as the Gain/Pain Ratio] was born… essentially, it is exactly as the Sharpe Ratio but stratifies favored and unfavored volatility. Favorable volatility is not penalized. Unfavorable volatility is scored as a legitimate demerit. It has always seemed fairer to me. (click to enlarge) The difference between the Sharpe and Sortino ratios Naturally, both ratios are relevant and higher values for both measurements reflect better risk-adjusted returns. And portfolio managers realize that, no matter the ratio, both need to be positive…or you are losing money. However, given full investment of capital, the Sharpe Ratio can be strongly positive yet still not offer high absolute returns. Conversely, if your Sortino Ratio is high, you are probably delivering very strong absolute returns… again, assuming full investment of capital. An Era of Painless Gains Given all of this… What is a good numerical value for both ratios? Generally, over time, any value > 1.5 is pretty good and numbers > 2.0 are stellar. Be advised the data may vacillate, a little bit, based on the time frame used in your calculation i.e. weekly or monthly. Recently, I constructed a model that required one, three and five-year Sharpe Ratios for the S&P 500. I also decided to include the Sortino Ratio. Prior to the results, I hypothesized that the numbers ought to be pretty impressive given the endless equity “bull” since March 2009, but I was still curious to get the exact data. Plus, a weekly price chart of the S&P 500, since 2009, visually reflects the anomaly of very limited drawdowns in the context of extremely strong returns. The calculations are as follows and as Mrs. Doubtfire once said…”Effie… Brace Yourself.” Sharpe Ratio 1-Year = 1.37 3-Year = 1.86 5-Year =1.0 Sortino Ratio 1-Year = 2.65 3-Year = 3.41 5-Year = 1.69 Collectively, these numbers are clearly impressive but even more so in that they are calculated from a passive, long only strategy. This is a hedge fund manager’s worst nightmare as, for five years, most “hedging” has proved to be only performance degrading. (click to enlarge) S&P 500 index – since the 2009 low, hedging has essentially just been a performance drag, with the possible exception of the 2011 correction. Furthermore, the Sortino Ratio data are nothing short of staggering. What they really say = Plenty of Gain with Very Little Pain … and it really is unsustainable if only because it has become much too easy to generate positive returns with very little effort, pain or savvy. To the Ignorant the Spoils It actually seems, at times, as though there is this mysteriously large buyer that suddenly appears whenever the equity market most “needs it”… and the subsequent buying is so aggressive and so desperate… not the style of the mostly steady “hands” I personally know. It just seems too good to be true and the Sortino Ratio numerically reflects that belief. Plus, we all know that the economic fundamentals are not as smooth as the weekly or monthly charts of the S&P 500 would suggest. Remember that equities typically offer the most risk of any asset class… not the lowest risk as the above data set suggests. Nevertheless, Yellen and Bernanke must be “psyched” as their “wealth effect” model has been so effective… actually too effective as the market distortions grow ever larger… and more market bears become contorted “road-kill.” To be sure these distorting effects may be entirely assigned to The Fed… the debt monetizing, interest rate suppressing “Masters of the Universe” who always get what they want while answering to nobody. They’ve literally trounced and expectorated on the concept of “moral hazard” and, it seems, purposely reconfigured and redefined its meaning into: We have no economic morals and this poses an enormous hazard to the performance of hedged money managers. The spoils go to the ignorant only – the Fed’s true heroes. Charts by: Advisor Central, BigCharts