Tag Archives: stocks

Best And Worst Q3’15: Information Technology ETFs, Mutual Funds And Key Holdings
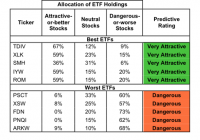
Summary Information Technology sector ranks second in Q3’15. Based on an aggregation of ratings of 28 ETFs and 129 mutual funds. TDIV is our top-rated Information Technology ETF and ROGSX is our top-rated Information Technology mutual fund. The Information Technology sector ranks second out of the 10 sectors as detailed in our Q3’15 Sector Ratings for ETFs and Mutual Funds report. It gets our Neutral rating, which is based on an aggregation of ratings of 28 ETFs and 129 mutual funds in the Information Technology sector as of July 9, 2015. See a recap of our Q2’15 Sector Ratings here . Figures 1 and 2 show the five best and worst-rated ETFs and mutual funds in the sector. Not all Information Technology sector ETFs and mutual funds are created the same. The number of holdings varies widely (from 23 to 397). This variation creates drastically different investment implications and, therefore, ratings. Investors seeking exposure to the Information Technology sector should buy one of the Attractive-or-better rated ETFs or mutual funds from Figures 1 and 2. Figure 1: ETFs with the Best & Worst Ratings – Top 5 (click to enlarge) * Best ETFs exclude ETFs with TNAs less than $100 million for inadequate liquidity. Sources: New Constructs, LLC and company filings Figure 2: Mutual Funds with the Best & Worst Ratings – Top 5 (click to enlarge) * Best mutual funds exclude funds with TNAs less than $100 million for inadequate liquidity. Sources: New Constructs, LLC and company filings The First Trust NASDAQ Technology Dividend Index ETF (NASDAQ: TDIV ) is the top-rated Information Technology ETF and the Red Oak Technology Select Fund (MUTF: ROGSX ) is the top-rated Information Technology mutual fund. Both earn a Very Attractive rating. The ARK Web x.0 ETF (NYSEARCA: ARKW ) is the worst-rated Information Technology ETF and The Rydex Internet Fund (MUTF: RYINX ) is the worst-rated Information Technology mutual fund. ARKW earns a Dangerous rating and RYINX earns a Very Dangerous rating. 527 stocks of the 3000+ we cover are classified as Information Technology stocks. Cisco Systems, Inc. (NASDAQ: CSCO ), a previous Stock Pick of the Week, is one of our favorite stocks held by TDIV and earns our Very Attractive rating. Since 2005, Cisco has grown after-tax profit ( NOPAT ) by 6% compounded annually. Cisco earns a top-quintile return on invested capital ( ROIC ) of 16% and has steadily become a free cash flow machine, generating $9.5 billion on a trailing-twelve month (TTM) basis. Fears of Cisco’s demise in a new age of technology have long kept the stock undervalued. At its current price of ~$28/share, Cisco has a price to economic book value ( PEBV ) of 0.9. This ratio implies the market expects Cisco’s profits to permanently decline by 10%. However, if Cisco can grow NOPAT by 5% compounded annually over the next decade , the stock is worth $36/share – a 28% upside. Proofpoint Inc. (NASDAQ: PFPT ) is one of our least favorite stocks held by ARKW and earns our Dangerous rating. Proofpoint is similar to many of our recent Danger Zone picks in that it touts high revenue growth but negative profits. From 2012-2014, Proofpoint grew revenue by 23% compounded annually. On the other hand, NOPAT declined from -$19 million to -$47 million. On a TTM basis, which includes 1Q15 results, NOPAT has fallen to -$52 million. Proofpoint’s pre-tax (NOPBT) margins are -26% and the company currently earns a bottom-quintile ROIC of -53%. The stock price has benefited from the hype surrounding cyber security companies and is now significantly overvalued. To justify its current price of $63/share, Proofpoint must immediately achieve 6% NOPBT margins (similar to peer Fortinet (NASDAQ: FTNT )) and grow revenues by 30% compounded annually for the next 16 years . If you want to be in a stock that benefits from the growth in cyber security, we recommend this recent stock pick of the week. Figures 3 and 4 show the rating landscape of all Information Technology ETFs and mutual funds. Figure 3: Separating the Best ETFs From the Worst ETFs (click to enlarge) Sources: New Constructs, LLC and company filings Figure 4: Separating the Best Mutual Funds From the Worst Mutual Funds (click to enlarge) Sources: New Constructs, LLC and company filings D isclosure: David Trainer and Max Lee receive no compensation to write about any specific stock, sector or theme. Disclosure: I/we have no positions in any stocks mentioned, and no plans to initiate any positions within the next 72 hours. (More…) I wrote this article myself, and it expresses my own opinions. I am not receiving compensation for it. I have no business relationship with any company whose stock is mentioned in this article.

Trading The Solar Earnings Season

In May, when TAN and KWT were near their peaks, we warned investors about the risks of these assets. A large number of these risks have been mitigated and on balance we feel a lot more optimistic about these ETFs. We expect most of the strong solar companies to outperform this earnings season and see TAN as a buy at this level. In May, when the solar ETFs were trading close to their peaks, we have written about Guggenheim Solar ETF (NYSEARCA: TAN ), Market Vectors Solar Energy Index ETF (NYSEARCA: KWT ) and identified the risk factors in these ETFs . At that time, TAN was trading in the $47+ range and KWT was trading in the $86+ range. Since the writing of the article, two of the risk factors materialized when Yingli Green Energy (NYSE: YGE ) and Hanergy Thin Film ( OTC:HNGSF ) collapsed causing a sector wide downdraft and triggering big losses at both the ETFs. Another risk factor in the form of solar assets also seems to have burst leading to a significant compression in the Yieldco space. At the time this article is being written, TAN was trading at $34+ and KWT at $64+. With losses around 30% from the peak, the question is if these ETFs have now reached an acceptable level of risk. To assess the current risk, we look back at the risk factors we identified earlier and review the status of the risk factors. 1. Hanergy: As we discussed earlier, Hanergy constituted about 12% of TAN and 8% of KWT. With the drop in Hanergy’s valuation prior to the stoppage of trading, and subsequent rebalancing of portfolios, Hanergy has been eliminated out of TAN but still accounts for about 2.5% of KWT holdings. However, we believe that this company is worth close to “0” and, therefore, there is still about 2.5% downside risk for KWT. 2. Solar Asset Bubble: Companies in this category include SolarCity (NASDAQ: SCTY ), Vivint Solar (NYSE: VSLR ), TerraForm Power (NASDAQ: TERP ), 8point3 Energy Partners (NASDAQ: CAFD ), and several other YieldCos. a. SolarCity remains a bubble as the macro environment for the company’s business model continues to deteriorate . In our view, fair valuation of SolarCity is likely around $15 compared to the current $57+ level. In other words, this component may have about 75% downside risk. b. The situation with Vivint Solar has now been mitigated due to its acquisition by SunEdison (NYSE: SUNE ) and TerraForm Power. As such, that acquisition along with other macro factors appears to have destroyed the valuation of SunEdison. c. For TerraForm Power, 8point3 Energy, NRG Yield (NYSE: NYLD ) and similar YieldCos, we believe the yields from these vehicles should be between 8 to 12% depending on the type of assets. These yields are for US-based assets and the actual yields should be adjusted for risk and growth potential. These yields have been increasing lately and, considering the current yields, we believe much of the Yieldco risk has now been mitigated. However, we see potential for another 25% valuation compression in this group of stocks. In spite of this additional downside, we believe this risk is substantially less than what it was at the time of our May missive. 3. Debt-laden companies: Several heavily indebted companies like Yingli Green Energy, China Sunergy (NASDAQ: CSUN ), Renesola (NYSE: SOL ), and GCL Poly ( OTCPK:GCPEF ) are likely to get reorganized, see a dramatic valuation compression, and may cease to exist altogether. While the recent downtrend at these companies have shaved off about 50% of the risk in these equities, we believe that this is just a start. We see the potential valuation compression for this group at near 100%. 4. ITC step-down risk: This risk is difficult to estimate since much depends on political action. We believe that the ITC expiration is likely to affect only a small set of US-centric companies such as SolarCity, Vivint Solar and RGS Energy (NASDAQ: RGSE ). We expect companies with strong IP (ex: First Solar) and companies with international projects to fare well post this event. The flipside of the risk argument, as we have noted before, is that strong solar companies will continue to perform well and grow. These strong companies include: First Solar (NASDAQ: FSLR ), SunEdison, SunPower (NASDAQ: SPWR ), Canadian Solar (NASDAQ: CSIQ ), JinkoSolar (NYSE: JKS ), and Trina Solar (NYSE: TSL ). The appreciation potential for this group of companies is substantial and, in many cases, may be as much as 2 to 4 times their current valuation. Each of these stocks could potentially overcome the headwinds one or more of the equities identified in the risk section above. We expect nearly all strong solar companies that we mention above to do better than guidance in Q2. The positive results could alter the negative sentiment for the sector and quickly build significant momentum in several of the names and potentially drive TAN and KWT through the earnings season. As such, we are believers of the solar growth story and we expect the growth aspects to overcome the risks in the ETF over time. While TAN and KWT are likely to be highly volatile for the 12 to 24 months, in the context of trading opportunities, it appears to us that the solar equities have taken a considerable undeserved beating in Q2 and are due for correction on the upside. Of these two ETFs, we prefer TAN to KWT and see it being a better value ahead of the earnings season. For long-term investors interested in less long-term volatility and a more solid asset growth, a better option would be to pick a basket of strong solar companies instead of investing in TAN or KWT. Our sentiment on TAN: Buy Editor’s Note: This article covers one or more stocks trading at less than $1 per share and/or with less than a $100 million market cap. Please be aware of the risks associated with these stocks. Disclosure: I am/we are long FSLR, SUNE, JKS, TSL, CSIQ, JASO. (More…) I wrote this article myself, and it expresses my own opinions. I am not receiving compensation for it (other than from Seeking Alpha). I have no business relationship with any company whose stock is mentioned in this article.