Tag Archives: stocks

Does X Mark The Spot?
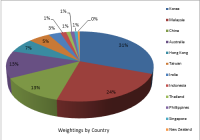
Heavily weighted towards cyclically sensitive sectors. The fund has holdings in top Asia-Pacific companies, excluding Japan. The exclusion of the Japanese economy doesn’t seem to serve any purpose. From its recovery after an ill-conceived, devastating global conflict, Japan underwent a complete restructuring under the leadership of Prime Minister Hayato Ikeda in the 1950s. The constitution was rewritten and modernized, heavy industry and infrastructure was reconstructed, bank regulations were eased and protectionist policies were instituted in order to focus on rebuilding the economy, organically. By the 1960s, referred to by economist as Japan’s ‘golden 60s’, the economy took off and continue to expand, from about $91 billion in 1965 to well over an astonishing $1 trillion by 1985. However, as often happens when left unchecked, growth became unsustainable leading to an asset bubble, which collapsed in 1989. For the next 25 years the economy was trapped in deflationary stagflation, during which time, plan after plan failed to re-inflate the economy. During this same period, the People’s Republic of China was in the process of transitioning from a communist agrarian economy to a more global free market industrial economy with great success. Other countries in the region benefited from the commodity demand generated; Australia, India, Korea, Taiwan, Singapore, India and New Zealand, to name a few. Indeed, Japan still plays a leading role on the Asia Pacific stage, but is no longer the sole regional super-economy. In our present time the Asia-Pacific region has developed into an astonishingly productive and efficient contributor to the entire global economy, with several regional trillion dollar economies. So the question becomes, how well do the Asian Pacific funds perform when Japan is removed from the equation? First, using the Seeking Alpha ETF Hub, and filtering Global/Intl Equities by positive one-year performance results with several ‘ex-Japan’ funds. Excluding ‘specialized’ funds, like ‘Ultras’, ‘Small Cap’, ‘Enhanced’ and the like leaves a few plain vanilla, Asia ex-Japan funds summarized in the table below. ( Data from respective fund websites ) In this category, the Deutsche X-Tracker MSCI Asia Pacific ex Japan Hedged EquityETF ( DBAP ) , as the name suggests includes Asia Pacific economies, excluding Japan. Although hedged, this does not entirely eliminate currency risk, but will dampen currency volatility. (Data from X-Trackers) The fund is most heavily weighted in Financials, 30%, followed by Information Technology, 25%; Industrials, 6%; Materials, 5%; Telecom Services, 4%; Consumer Discretionary, 5%; Consumer Staples, 4%; Energy, 4%; Utilities, 3% and Healthcare at 13%. (Data from X-Trackers) It’s also interesting to note the heaviest sector weightings by country. Australia has the heaviest weightings in Consumer Staples, Financials, Health Care and Materials. China holds the heaviest weightings in Energy, Industrials, Telecom, and Utilities. Hong Kong leads the way in Consumer Discretionary and Korea weights most in the IT sector. This is important to note. China and Australia are major trade partners. Slowing demand in China means a slower Australian economy. Australia has its heaviest weightings are mostly defensive with just one very cyclical sector, Materials. (Data from X-Trackers) At this point, a few words need to be said for the trade dynamic in the region. Japan’s major export partners in the region are China, South Korea, Thailand, Hong Kong, Indonesia, Australia, Singapore and Malaysia. Top export products include Cars, Vehicle Parts, Industrial Printers, Specialized Machinery, Construction Equipment and numerous other industrial products. Hence, by omitting Japan, a major industrial manufacturer, supplier and regional economic contributor, that is to say, a potential major contributor to the fund’s performance is omitted. Excluding the Asia-Pacific region, Japan’s second largest import partner is the United States. Even a slow US economy will conduct sizable trade with Japan, particularly in durable goods. Hence, by omitting Japanese industry from the fund, a major factor is omitted. (It should be noted that other non-Asia-Pacific top export partners include Germany, Mexico, Russia, Canada and the U.K.). (click to enlarge) (Data from OEC) Japan is an integral part of the Asia-Pacific region. Even if the Japanese economy is excluded, its presence implicitly impacts the region, hence the fund, to some extent. China, Australia, Singapore, Hong Kong, New Zealand, South Korea and Indonesia, are developed or recently emerged economies. So excluding Japan does not make this an ’emerging market’ fund, nor can it be really be considered a ‘regional economy’ fund without Japan. The fund seems to be structured on the premise that Japan is the leading economy in the region, whose metrics overwhelm the other regional economies. However, by any measure, Japan fits right in with the locals. The point being is that when compared to its regional neighbors, there is nothing overly exceptional nor detracting about the Japanese economy which dominates the region, necessitating its exclusion. (click to enlarge) The fund trades in a rather strong premium to NAV range: mostly 0.5% to 1.0% and at times as much as 1.5% to 2.0% of NAV, rarely trading at a discount to NAV. Also, management fees are slightly on the high side with a net expense ratio of 0.60%. The fund has been trading since October of 2013. Naturally, before making any investment, it’s always worth reading the fund’s prospectus . Disclosure: I/we have no positions in any stocks mentioned, and no plans to initiate any positions within the next 72 hours. (More…) I wrote this article myself, and it expresses my own opinions. I am not receiving compensation for it (other than from Seeking Alpha). I have no business relationship with any company whose stock is mentioned in this article. Additional disclosure: “CFDs, spread betting and FX can result in losses exceeding your initial deposit. They are not suitable for everyone, so please ensure you understand the risks. Seek independent financial advice if necessary. Nothing in this article should be considered a personal recommendation. It does not account for your personal circumstances or appetite for risk.”
Time For Airline ETF After Solid Earnings Season?

The airline stocks, which were flying low for the last three months on a stronger dollar and global growth worries cutting back on frequent flies, gained altitude and picked up speed following robust earnings this season. As a result, the pure-play aviation ETF U.S. Global Jets ETF (NYSEARCA: JETS ), which lost 2.9% in the last three-month period, advanced about 5% in the last one month (as of July 29, 2015) . In any case, cheap fuel has been a windfall for long. The mounting middle-income population in emerging markets is benefitting worldwide customer growth. Now solid earnings results from top-notch companies have come as a feather in the cap. To add to this, United Continental Holdings Inc. (NYSE: UAL ) recently reduced its 2015 domestic capacity growth outlook. Delta Airlines (NYSE: DAL ) too plans to raise the rewards’ program fare prices from June 1, 2016. All these initiatives by major industry players are likely to shore up the pricing profile of the sector. The sector is now in the top 44% category of the Zacks Industry Ranks. Let’s take a look at some of key earnings of the sector: Delta Air Lines reported impressive better-than-expected earnings and revenues in the second quarter of 2015. To lessen the unfavorable impact of foreign exchange on its international operations, Delta plans to slash its international capacity by 3.5% in the fourth quarter of 2015. Delta’s domestic revenues were strong with about 5% growth. Delta expects weak fuel prices to stay and continue to benefit earnings for the rest of the year. The carrier projects fuel costs per gallon in the band of $1.90 to $2.00 in the second half which is way below $2.65 per gallon noticed in the first half of 2015. The average fuel price at Delta in the second quarter of 2015 was $2.40 per gallon, down 18% sequentially. This Zacks ETF Rank #3 (Hold) stock has a Zacks Growth & Value style score of ‘A’. United Continental came up with mixed Q2 results this month with an earnings beat and a revenue miss. Earnings were up 41.5% year over year on lower fuel costs. Revenues declined 4% on lower passenger revenues. Cargo revenues and other revenues were also downhill. Its indicators are also very promising with a Zacks ETF Rank #3, Growth, Value and Momentum scores of ‘A’. Yet another leading U.S. carrier Southwest Airlines Co. ‘s (NYSE: LUV ) second-quarter 2015 bottom line matched the Zacks Consensus Estimate while the top line missed the same. But investors should notice that revenues grew 2% year over year helped by 2.1% and 4.5% expansion in Passenger and Freight revenues, respectively. Airline traffic was up 7.9% while passenger load factor inched up to 84.6% from 83.9% recorded in the year-ago quarter. LUV, with a Zacks ETF Rank #3, also boasts hopeful indicators of Growth score of ‘B’ and Value score of ‘A’. American Airlines Group (NASDAQ: AAL ) had a mixed quarter with a bottom-line beat and top line miss. Though this is a Zacks ETF Rank #5 (Strong Sell) stock and its operating metrics were downbeat in Q2, the company is worth a look as it emphasizes shareholder returns. The board of directors has authorized an additional $2 billion share buyback program. This stock is also a great pick for growth and value investors. Apart from these heavy-weight stocks, the sector has seen sturdy performances by others. Alaska Air Group, Inc. ‘s (NYSE: ALK ) Q2 2015 earnings per share of $1.76 beat the Zacks Consensus Estimate of $1.73 and improved 56% from the year-ago earnings. Revenues grew 5% year over year and matched our estimates. It is a Zacks ETF Rank #2 (Buy) stock with a Growth and Value scores of ‘A’. Though JetBlue Airways Corporation ‘s (NASDAQ: JBLU ) second-quarter 2015 earnings per share matched the Zacks Consensus Estimate and revenues missed the same, the top and bottom lines grew year over year. JBLU has a Zacks ETF Rank #2, Growth and Value scores of ‘A’ and a Momentum score of ‘B’. By now, one must have realized that the underlying trend is solid in the airlines industry. So, investors might play the trend via basket approach to tap the entire potential of the space. And to do so, what could be the best option other than JETS ETF? The fund holds 33 stocks in its portfolio and is concentrated on a few individual securities, as it allocates about 70% to the top 10 holdings. United Continental (12.4%), Delta Airlines (12.33%), Southwest (12.23%) and American Airlines (11.04%) are the top four elements in the basket, with a combined share of about 45%. Other firms mentioned above also get places in the top 10 chart, each with over 4% weight. The product charges 60 bps in fees. Link to the original article on Zacks.com

Mutual Fund Investors Take Wait-And-See Approach Ahead Of FOMC Meeting

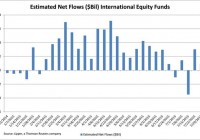
By Tom Roseen Despite the flight to safety and what many market pundits might have expected-a subsequent uptick in flows to money market funds, for the second week in three investors were net redeemers of fund assets (including those of conventional funds and exchange-traded funds [ETFs]), withdrawing a net $6.2 billion for the fund-flows week ended, Wednesday, July 29. Investors pulled money out of all four of Lipper’s major macro-groups, redeeming $3.5 billion from taxable bond funds, $1.8 billion from equity funds, $0.9 billion from money market funds, and $73 million from municipal bond funds. Weak earnings reports from bellwether stocks such as American Express (NYSE: AXP ), Caterpillar (NYSE: CAT ), and 3M (NYSE: MMM ), accompanied by a hangover from China’s market meltdown, outweighed a drop in weekly applications for unemployment benefits to the lowest level since 1973. Investors shrugged off a better-than-expected earnings report from Amazon and ignored the Anthem (NYSE: ANTM )-Cigna (NYSE: CI ) M&A news and the announcement that Greek officials had approved a second set of austerity measures. Instead, investors focused on the continued decline in oil, the selloff in commodities, concerns over a decline in global economic growth, and a housing report that showed the largest slowdown in single-family-home sales in seven months. Ho-hum economic data and sketchy guidance from U.S. firms during the flows week initially led investors to safe-haven plays, especially after the Shanghai Composite’s largest one-day slide (-8.5%) since February 2007. Despite a better-than-expected June durable goods report, investors took a wait-and-see approach ahead of the two-day Federal Open Market Committee meeting, leading to a small rally in U.S. Treasuries. However, in the last two days of the flows week U.S. stocks rallied after China stocks showed a more tempered decline and oil prices rose for the first time in five sessions. On Wednesday, July 29, the Dow marked its fifth straight session of triple-digit moves, this time to the upside after the Federal Reserve left itself wiggle room to raise rates as early as September, citing a continuation of solid gains in the job market. Investors cheered Citrix’s better-than-expected earnings report, Chinese stocks moved higher, and crude oil had its second biggest one-day gain for July, with futures rising 1.7% for the day. Nonetheless, the Dow Jones Industrial Daily Reinvested Average still finished the flows week down 0.56%. (click to enlarge) Source: Lipper, a Thomson Reuters company Interestingly, fund investors collectively kept their foot on the gas pedal for a few risk-on plays, injecting net new money into international equity funds (+$0.9 billion), health/biotechnology funds (+$0.6 billion), mid-cap funds (+$0.2 billion), and science & technology funds (+$0.1 billion). Except for small net flows into government/Treasury funds (+$0.4 billion) during the week, the typical safe-haven plays didn’t attract net new money as investors appeared to be waiting on the policy statement by the Fed to plan their next steps. Year to date, international equity funds (including traditional funds and ETFs) have attracted $135.1 billion of net new money, while their domestic equity counterparts have suffered net redemptions to the tune of $54.7 billion.