Tag Archives: stocks

5 Buy Ranked Small Cap Growth Mutual Funds To Invest In

Growth funds become a natural choice for investors when capital appreciation over the long term takes precedence over dividend payouts. These funds focus on realizing an appreciable amount of capital growth by investing in stocks of firms whose value is projected to rise over the long term. Small cap funds are a good choice for investors seeking diversification across different sectors and companies. Investors with a high risk appetite should invest in these funds. Small cap funds generally invest in companies having market cap lower than $2 billion. The companies, smaller in size, offer growth potential and their market capitalization may increase subsequently. Below we will share with you 5 buy rated small cap growth mutual funds. Each has earned a Zacks #1 Rank (Strong Buy) or a Zacks #2 Rank (Buy), as we expect these mutual funds to outperform their peers in the future. PNC Multi Factor Small Cap Growth A (MUTF: PLWAX ) seeks capital growth over the long run. PLWAX invests a lion’s share of its assets in small cap companies. The market capitalizations of these companies are identical to the size of the companies listed in the Russell 2000 Growth Index or less than the past three years average of the largest capitalization company listed in the index. The PNC Multi Factor Small Cap Growth A fund has returned 21.5% over the last one year. PLWAX carries an annual expense ratio of 1.12% as compared to category average of 1.34%. BlackRock Small Cap Growth Equity Investor A (MUTF: CSGEX ) invests a major portion of its assets in domestic small cap companies. CSGEX defines small cap companies as those which are having market capitulation size within the range of the Russell 2000 Index. CSGEX may also consider IPOs for potential investment. The BlackRock Small Cap Growth Equity Investor A fund has returned 15.6% over the last one year. Travis Cooke is the fund manager and has managed CSGEX since 2013. Hartford SmallCap Growth A (MUTF: HSLAX ) seeks capital growth over the long run. HSLAX invests a lion’s share of its assets in small cap companies having market capitalizations similar to those included in the Russell 2000 and S&P SmallCap 600 Indices. HSLAX maintains a multi-portfolio manager structure. HSLAX may invest a maximum of 20% of its assets in non-dollar denominated securities of companies located in foreign land. The Hartford SmallCap Growth A fund has returned 19.4% in the last one year. As of June 2015, HSLAX held 350 issues with 1.96% of its assets invested in iShares Russell 2000 Growth. Harbor Small Cap Growth Investor (MUTF: HISGX ) mostly invests in small cap companies, whose market capitalization lies within the range of the Russell 2000 Growth Index. HISGX invests a large portion of its assets in a diversified portfolio of equity securities of around 75 to 85 small cap companies. The Harbor Small Cap Growth Investor fund has returned 20.7% over the last one year. HISGX has an expense ratio of 1.2% as compared to category average of 1.34%. Invesco Small Cap Discovery A (MUTF: VASCX ) seeks capital appreciation. VASCX invests heavily in small cap companies that are believed to have strong capital growth prospect. VASCX may allocate a maximum of 25% of its assets in foreign companies. The Invesco Small Cap Discovery A fund has returned 19.3% over the last one year. As of June 2015, VASCX held 105 issues with 1.64% of its assets invested in Cavium Inc.
SCHH: Finally The REIT Indexes Are Going Back On Sale; Limit Order Placed

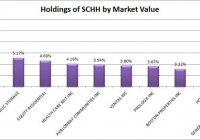
Summary SCHH is trading lower at the same time as treasury yields are falling. When SCHH falls under $38.00 per share, I become interested in buying more. As of my writing I have a buy limit order in place for my personal accounts. I would like to see less SPG in the portfolio to improve diversification, however the rest of the portfolio is beautifully diversified. The Schwab U.S. REIT ETF (NYSEARCA: SCHH ), also known as “Schwab Strategic Trust” on Google, fell today (August 6th, 2015) in early trading and was down by .78% within the first couple hours. The drop in SCHH is interesting because it came while treasury yields were falling. When treasury yields are weak, income investors are more inclined to take on the risks of investing in an equity REIT index to achieve higher yields. As an investor, I love equity REIT indexes and I am long SCHH and the Vanguard REIT Index ETF (NYSEARCA: VNQ ) in my retirement accounts. Why Both? The first equity REIT index that really attracted me was VNQ and I began buying into it. Since then I began the process of moving my brokerage over to Charles Schwab and have free trading on SCHH which makes it more desirable for new allocations. Buying Strategy If I were to simplify my views on SCHH as far as possible it would be like this: Under $38.00 SCHH is a solid deal. The lower it goes, the better the deal. Seeing SCHH fall under $38.00 I decided to place some limit buy orders on SCHH. Since the ETF is so thoroughly diversified (within equity REITs), I’m confident about the underlying fundamentals of the fund. Even though I’m already heavily invested in SCHH and VNQ, I view price drops as favorable because I’m holding some cash and looking to buy more every time the price falls. I got lucky enough to buy in late June when prices were hitting at least a temporary bottom. I would love to say it was pure skill in timing the recovery, but that is absurd. I got home from a vacation, saw cheap shares, and put in a limit buy order. Holdings The holdings are shown in the chart below: (click to enlarge) There is only one meaningful concern I have about buying into SCHH. I feel that their allocation to Simon Property Group (NYSE: SPG ) is simply too large. It hurts the diversification of the portfolio to have 10% invested into a single equity REIT. Regardless of how the portfolio managers feel about this allocation, I don’t like it. I would rather see this allocation dropped to around 5%. Retail REITs The largest sector holding for SCHH is the retail REIT sector. My preferred part of the equity REIT market is the residential REITs, but when it comes down to building a portfolio the diversification into the different parts of the REIT market offer superior risk adjusted returns over the long haul. Simon Property Group I have no current business relationships with Simon Property Group. However, quite a while ago I ended a business relationship with one of their properties. I ended that relationship for two reasons. One is that I was moving farther away from the location and the other is that their system was not friendly to those leasing property. When I was dealing with one of their leasing managers they were too focused on establishing rental rates and sales expectations on a “per square foot” metric. That was a problem because they were offering breaks on expectations for leasing larger amounts of space which turned into breaks for customers were willing to play the game by adjusting square foot usage through building taller displays. The spaces I was leasing were adjacent to customer traffic pathways and were otherwise nearly useless due to how small they were. Of course, my experience is only that of one customer dealing with the leasing manager for one mall. However, getting a feel for the way the leasing business was structured left me feeling concerned that the strategy was less than optimal. Dividend Yield The dividend yield on SCHH is only 2.27% which is incredibly low for an equity REIT index. With reasonably similar holdings VNQ is offering a 3.89% dividend yield. Because the holdings are very similar, I consider SCHH and VNQ to be very comparable when placed inside a tax advantaged retirement account with no plans to withdraw in the next couple decades. On the other hand, if an investor was living off the dividends they would have a solid reason for preferring VNQ over SCHH. If Prices Fall Further The more prices fall, the more limit buy orders I plan to place. My retirement accounts right now contain a meaningful allocation of cash. The return on cash and equivalents is terrible, but I’m holding the cash so I can look for some bargain prices on my favorite investments. If prices fell as low as $36 or $35 my cash position would be mostly gone as I would keep going back to get more shares. Max Allocation Many investors appear to think (judging from comments on my articles) that allocating more than 20% of a portfolio to domestic equity REITs is too heavy. I’m willing to see my allocations go as high as around 40% on domestic equity REIT indexes. The volatility on a diversified REIT index like SCHH is fairly reasonable when compared to other major investments like total stock market indexes or the S&P 500. Due to moderate levels of correlation, the total risk level on the equity portion of the portfolio can often improve as allocations move up towards 40% to 50%. Note that this is referring only to allocation within the equity portion of the portfolio. Clearly replacing cash or high quality short duration bond funds with SCHH or VNQ will result in more portfolio risk. Conclusion I love SCHH as an investment vehicle. I’m long both SCHH and VNQ and I have a buy limit order on SCHH at $37.85. Disclosure: I am/we are long SCHH. (More…) I wrote this article myself, and it expresses my own opinions. I am not receiving compensation for it (other than from Seeking Alpha). I have no business relationship with any company whose stock is mentioned in this article. Additional disclosure: Information in this article represents the opinion of the analyst. All statements are represented as opinions, rather than facts, and should not be construed as advice to buy or sell a security. Ratings of “outperform” and “underperform” reflect the analyst’s estimation of a divergence between the market value for a security and the price that would be appropriate given the potential for risks and returns relative to other securities. The analyst does not know your particular objectives for returns or constraints upon investing. All investors are encouraged to do their own research before making any investment decision. Information is regularly obtained from Yahoo Finance, Google Finance, and SEC Database. If Yahoo, Google, or the SEC database contained faulty or old information it could be incorporated into my analysis.

Retail-Related Funds Rise On Higher Earnings From Core Holdings

Summary Despite weak retail sales forecasts, the Direxion Daily Retail Bull 3x ETF has risen on Amazon’s higher earnings like a drone for home delivery. The Fidelity Select Retailing Portfolio has also soared, on the back of strong retailers, and offers an unleveraged exposure to this sector. However, other ETFs in the retail sector, such as the XRT Retail SPDR is mired in a consolidation. A handful of retail stocks are the key to this out-performance. As key retailers get stronger can the market be far behind? Introduction: Lowered Retail Sales Forecasts The National Retail Federation recently lowered their forecast for the 2015 calendar year from +4.1 percent to +3.5 percent (see reference 1). They also lowered their back-to-school spending by as much as -9 percent (see reference 2). These lowered forecasts are seen in the performance of say the SPDR S&P Retail ETF (NYSEARCA: XRT ) , which is stuck in a trading range between approximately 96 and 102 (see Figure 1). (click to enlarge) Figure 1: The SPDR Retail ETF is stuck in trading range, consistent with lack luster retail sales forecasts. (Chart courtesy StockCharts.com) AMZN, PCLN Report Strong Earnings In the current earnings season, Amazon (NASDAQ: AMZN ) reported a quarterly EPS of $0.19 per share, versus a consensus of a loss of -$0.15 per share (reference 3), pushing sharply higher (see Figure 2). Then Priceline (NASDAQ: PCLN ) pushed to all time highs on its earnings report (see reference 4), coming it at $11.57 versus an expectation of $11.10. Clearly, some retailers have something up their sleeve. (click to enlarge) Figure 2: Amazon has soared on higher earnings (Chart courtesy StockCharts.com) (click to enlarge) Figure 3: Priceline pushed to all time highs on earnings (Chart courtesy StockCharts.com) Select Retailers Now Trending Strongly The markets have rewarded the improved earnings by pushing these stocks higher. Their relative out-performance can be measured using the table below (see Figure 4). The absolute medium-term trend strength of the Fidelity Select Retailing Portfolio ( FSRPX) and the Direxion Daily Retail Bullish 3x ETF ( RETL) put them in the top tier of all funds. They are much stronger than the broader S&P-500 index which is only at 52, and are soaring compared to the Apple (NASDAQ: AAPL ), the other retailing giant. (click to enlarge) Figure 4: The absolute trend strength of FSRPX and RETL puts them in the top tier. Note how they are much stronger than retailing giant AAPL, and the S&P-500 index itself. (Data courtesy ETFmeter.com) Leveraged and Un-leveraged Opportunities It is rare to find two such similar funds offering both leveraged and unleveraged investing opportunities into a particular sector with such near perfect correlation. The Fidelity Select Retail portfolio is unleveraged, and has good liquidity. RETL is leveraged, but has less liquidity. The leverage can cut both ways, should the market correct, and hence many might prefer the FSRTX to the RETL for further analysis. XRT is another unleveraged way to track the fortunes of retailers going into the fourth quarter with good liquidity and without the volatility that leverage can bring. Portfolio Weights Secret to RETL and FSRPX success RETL has a very large exposure to AMZN stock (see Figure 5 or reference 5). Almost 41% of the fund is in just three stocks. Even Home Depot (NYSE: HD ) is helping by breaking out to new highs. The portfolio for FSRPX is similar, though they do not give the same breakdown. About 67% of the FSRPX is in Home Depot, Amazon, Priceline, TJX companies (NYSE: TJX ) , O’Rielly Automotive (NASDAQ: ORLY ), G III (NASDAQ: GIII ), Lowes (NYSE: LOW ) and Ross Stores (NASDAQ: ROST ). So, the key to the success of these two funds is their portfolios (see Figure 6). A detailed comparison to other ETFs in the sector and other technical data are available at reference 6. Figure 5: The most recent portfolio weights for RETL (see reference 5) show a large position in Amazon, which has helped its performance. (click to enlarge) Figure 6: The returns of RETL and FSRPX have near perfect 0.99 correlation over the long-term. Thus, you can use the less leveraged option with similar approaches to this sector. (Chart courtesy StockCharts.com) Looking Ahead All retailers are clearly not the same. Some have harnessed technology to their competitive advantage. Traditionally, the last quarter of the year is the best quarter for retail earnings. So better days are ahead for the strongest retailers, as the economy picks up in the second half. Plus, this sector offers both unleveraged and leveraged funds to suite your comfort level. As key retailers strengthen, can the rest of the market be far behind? References National Retail Federation revises down 2015 US retail sales forecast Retail sales forecasts: Something doesn’t add up NASDAQ AMZN Earnings NASDAQ PCLN Earnings Direxion Investments ETFmeter Disclosure: I/we have no positions in any stocks mentioned, and no plans to initiate any positions within the next 72 hours. (More…) I wrote this article myself, and it expresses my own opinions. I am not receiving compensation for it. I have no business relationship with any company whose stock is mentioned in this article.