Tag Archives: stocks
Market Lab Report – Premarket Pulse 8/10/15
Major averages fell again but on lower volume with the S&P 500 bouncing off its 200dma. The majors managed to claw back part of their losses to close in the upper half of their trading ranges. Nevertheless, both the Dow Jones Industrials and Russell 2000 are below their 200dmas while the NASDAQ Composite and S&P 500 are under their 50dmas. Commodities continue to skate on thin ice as many are approaching or are at multi-year lows. Each time the NASDAQ Composite has traded under its 50dma this year, a floor has been found within 2 weeks or less with corrections typically between 4-5%. That said, this is the first time this year both the Dow and Russell 2000 are under their 200dmas, thus technical conditions have worsened. The inability of the major markets to advance in consistent fashion is a sign that, for the first time since 2009, QE is not pushing the markets higher. The bulls would say this is due to the markets, which are forward looking by typically 4 to 6 months, telegraphing a rate hike which, historically, has been a bullish event though has resulted in a correction of some magnitude 4 to 6 months ahead of the first rate hike. The bears, on the other hand, would say it could mean more serious trouble ahead given the unprecedented situation in which the world finds itself. Whatever the reason, staying in the present, watching the markets and your stocks, is key. The unemployment report came somewhat in line with expectations, though average hourly earnings climbed less than expected and the labor participation rate remained at depressing levels not seen since the late 1970s. Still, futures are showing a 60% chance of a rate hike when the Fed meets in December. Nevertheless, the Federal Reserve is concerned about low inflation and won’t hike rates until it sees inflation return to more normal levels, according to Stanley Fischer, the vice chairman of the US central bank.
Revisiting The 100 Stocks With The Lowest Volatility In S&P 500 Index
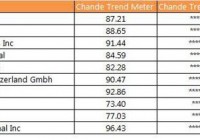
Summary We expand the discussion from a recent Editor’s Pick on building portfolios with the lowest volatility stocks in the S&P 500 Index. We point out that high beta is not necessarily high momentum and discuss why low volatility stocks might provide stronger performance. We simulate the portfolio construction calculations behind the S&P 500 Low Volatility Index and construct the current Top-10 portfolio holdings. We re-rank the lowest volatility stocks by momentum metrics to find stocks trending higher even in the current choppy market conditions. Introduction In a recent Editor’s Pick , Ploutos discussed the relative merits of using low volatility and high beta funds to generate better returns than the SPX (Ref 1). He combined the PowerShares S&P 500 Low Volatility Portfolio (NYSEARCA: SPLV ) and the PowerShares S&P 500 High Beta portfolio (NYSEARCA: SPHB ) to improve returns. His analysis is open to two criticisms. First, he was using a high beta portfolio as a substitute for a momentum strategy. However, high beta does not necessarily mean high momentum. Naturally, these terms are not cast in stone, and differences in calculation methodology and time period of data used in the analysis can change the measured beta as well as calculated momentum. So, for example, a fund like the PowerShares DWA Momentum Portfolio (NYSEARCA: PDP ) could be substituted for the SPHB portfolio. Second, he does not discuss why a stock may have low volatility, why a group of 100 stocks with the lowest volatility had returns greater than the full 500-strong index, and why this outperformance should persist for years on end. Thus, it is theoretically possible to go through a prolonged period during which the 100 stocks with the lowest volatility as a group do not consistently outperform the full index or their high-beta cousins quarter after quarter, and two groups flip flop back and forth negating any benefit of switching from one group to another. Why do stocks have low volatility? There are many reasons a stock could have low volatility. A stock may have low volatility because it has slow earnings growth and does not have the price amplitude, volume and spreads to catch the fancy of short-term traders. The stock may have large institutional ownership, and any dip in the stock leads to greater accumulation by institutions, so that large drops are rare. The earnings could be highly predictable and consistent, so the stock does not produce either positive or negative earnings surprises. The stock could have a large dividend payout, so it trades more like a bond than a stock. The stock could have gone through a period of very high volatility, that has shaken “weak longs” out of the stock, and volatility has diminished as the stock goes through a consolidation. A stock may be viewed as having a conservative management with high cash-flow, slow-growth businesses, that are not sensitive to strength or weakness in the economy. Hence, low volatility could be proxy for slow growth, high cash generators with large institutional ownership that are perceived as “low risk” investments. Thus, the exact reasons that a stock has low volatility over a given period and its implications for price advancement over the immediate future are unclear. Also, there could be numerous other reasons for low volatility in a stock. Why do low volatility stocks outperform the full index? In the ideal scenario, a stock has low volatility, is accumulated, and volatility increases due to favorable developments in the stock, such as improved growth prospects, and the stock breaks out into a strong trend. For example, management could focus on cutting costs and buying other companies with higher-margin products in the same sector. Thus, trading low volatility becomes a counter-trend entry into a stock that will morph into a growth story in the future. In this scenario, this stock starts off as a low volatility entity that shifts gears into a high growth phase, accounting for its outperformance. Of course, it will eventually drop off the 100-lowest volatility list, but then, its substitute will ideally repeat the same pattern. Alternately, the external market environment deteriorates, due to a weak economy or geo-political risks, prospects for price acceleration are murky or confusing, and money comes out of high-beta or high-volatility stocks and rotates into low-volatility stocks, being used as a temporary hedge or defensive position against market worries. These conditions could last for several quarters, and would again account for out-performance versus the full index. Naturally, there could many other possibilities for why low volatility stocks perform better than the index as a whole, such as buy-outs, rising dividends or a prolonged period of very low interest rates. Current State of Play: SPLV ETF As we have discussed above, low volatility does not have to mean low returns, especially when these stocks are used as a bulwark against market uncertainty. We perform a full trend analysis of the top-10 holdings of the PowerShares SPLV ETF (see Figure 1) below. The Top 10 are trending well, with good buying support for CB and BAX in particular. (click to enlarge) Figure 1: The current Top-10 holdings in the SPLV ETF are trending well given all the uncertainty in the market. (Data courtesy ETFmeter.com ) Updated Holdings through August 6 We asked the question: what would the current top 10 look like? We copied the methodology of the index and our updated top-10 holdings are shown in Figure 2. From Figure 1, XL Company (NYSE: XL ) and Stericyle (NASDAQ: SRCL ) are the only two companies in the top 10. One can then argue that an equally weighted portfolio would be better, since the rebalancing would only involve stocks which dropped out of the 100 least volatile stocks group. Figure 2: We update the portfolio weights using data through August 06 and the methodology described by the index provider. Only two of stocks, XL and Stericycle from the current top-10 in the SPLV ETF are on the list. (Data courtesy ETFmeter.com) The Best Trending of the 100 Lowest Volatility Stocks We can now ask the question: which are the best trending of the 100 stocks with the lowest volatility in the S&P 500 index? How are they doing? If money is rotating into low-volatility stocks in the face of market worries, then the 10 best trending stocks out of the 100 stocks with the lowest volatility in the S&P 500 index should be largely defensive stocks with steady earnings. We check this hypothesis in Figure 2 below using data through August, 06 2015. We find that out of the lowest 100 stocks, seventeen stocks seem to be surging, and we show them in Figure 3. The charts are somewhat similar, and we show the charts of Kellogg (NYSE: K ) and Clorox (NYSE: CLX ) to illustrate this idea (see Figures 4 and 5). Figure 3: The 17 stocks with the strongest trends in the 100 stocks with the lowest volatility in the S&P 500 index are a who’s who of defensive stocks. (Data courtesy ETFmeter.com) (click to enlarge) Figure 4: The Kellogg chart is rising strongly during the recent market uncertainty after analyst upgrades. (Chart courtesy StockCharts.com) (click to enlarge) Figure 5: The chart for Clorox looks quite similar to the one in Figure 4, showing the defensive rotation into low volatility stocks. (Chart courtesy StockCharts.com) Summary The low volatility group in the S&P 500 index can offer a respite in the rough seas of a choppy market. There are many alternatives to constructing portfolios with the lowest 100 volatility stocks and combining them with high beta and pure momentum strategies. Disclosure: I/we have no positions in any stocks mentioned, and no plans to initiate any positions within the next 72 hours. (More…) I wrote this article myself, and it expresses my own opinions. I am not receiving compensation for it. I have no business relationship with any company whose stock is mentioned in this article.