Tag Archives: stocks

Backtesting The Hedged Portfolio Method
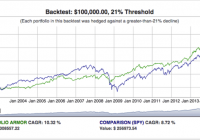
The hedged portfolio method enables investors to precisely specify and strictly limit their risk. From 1/2/2003 to 4/30/2014, net of trading fees and hedging costs, the hedged portfolio method generated a CAGR as high as 11.06% versus 8.72% for SPY. The security selection method generated alpha using price history and options market sentiment. The backtests uncovered interesting relationships between hedging methods, costs, and security returns. The Hedged Portfolio Method The goal of the hedged portfolio method is to generate competitive returns for an investor while strictly limiting his risk. For example, an investor unwilling to risk more than a 10% drawdown over the next six months (i.e., an investor whose “threshold” was 10%) could invest in a hedged portfolio structured to maximize his expected return while insuring that, in the worst case scenario (each of his underlying securities going to zero), his portfolio would decline no more than 10% over that time period. Our backtests determined that the hedged portfolio method can achieve competitive returns while strictly limiting risk. Below, for example, is a chart showing the performance of a series of 21% threshold hedged portfolios from 1/2/2003 to 4/30/2014, versus the performance of SPY over the same period. (click to enlarge) How It Works In broad strokes, this is the process for creating a hedged portfolio: Calculate a potential return for every hedgeable security in your universe (the Portfolio Armor universe consists of the 3,000+ hedgeable stocks and exchange traded products traded in the U.S.). Calculate the cost of optimally hedging each security. Subtract 2. from 1. to get potential returns net of hedging costs, or net potential returns. Rank the securities in order of their net potential returns. Pick a handful of the securities with the highest net potential returns to populate a concentrated portfolio and hedge them according to the investor’s risk tolerance. There are a few additional steps we employ to minimize cash levels and maximize potential returns, but that’s the basic idea. Here is an example of what a hedged portfolio looks like. That one was created on August 11th, 2015, and was designed for an investor who wanted to invest $1,000,000 while limiting his downside risk to a drawdown of no more than 18% over the next six months. That portfolio includes the stocks with highest potential returns in Portfolio Armor’s universe as of that date: Amazon, Inc. (NASDAQ: AMZN ), Expedia, Inc. (NASDAQ: EXPE ), Mondelez (NASDAQ: MDLZ ), Norwegian Cruise Line Holdings (NASDAQ: NCLH ), Netflix, Inc. (NASDAQ: NFLX ), Regeneron Pharmaceuticals (NASDAQ: REGN ), and Tyler Technologies (NYSE: TYL ). It’s clear that the first step in creating a hedged portfolio, calculating potential returns, is crucial, for two reasons: first, if you can’t select securities with the potential to generate alpha, your hedged portfolio returns will lag; second, in order to know if it’s worth the cost of hedging the securities, you need to have an idea of how accurate your potential returns are. So, before backtesting the hedged portfolio method as a whole, first we backtested our security selection method. Backtesting Our Security Selection Method Every trading day, Portfolio Armor generates high-end estimates of how more than 3,000 stocks and exchange traded products will perform over approximately the next six months. These estimates are based on analysis of historical returns as well as option market sentiment (determined by the cost of hedging each security in various ways), which provides a forward-looking element. We call this high-end estimate a security’s potential return. Essentially, it’s how the security might perform over the next six months in a bullish scenario. We backtested this method by running our analysis every trading day from 1/2/2003 to 10/31/2013 and then looking at the actual returns of the securities with the highest potential returns on our daily scans over the next six months. Over that 11-year period, we conducted 25,412 comparisons of our calculated potential returns to actual returns, an average of 9.4 top-ranked securities each trading day. The average potential return we calculated was 22.4%. The average actual return over the next six months, unhedged, was 6.84%. Since the average actual return was 0.3x the average potential return, we use that 0.3x multiple to derive expected returns from our potential returns. While a potential return represents a bullish upside, an expected return is the more likely result. A subset of our top-ranked securities – 5,202 of them, or about 20% of them – had an even higher average actual return: 9.35%. All of our top-ranked securities were hedgeable with optimal collars, but the securities in this subset were also hedgeable with optimal puts (we call these AHP securities, for short). There aren’t always AHP securities available, but when there are, our portfolio construction algorithm gives preference to them proportional to their higher average returns in our tests. Specifically, we increase their potential returns by 37%, since 9.35% is 1.37x 6.84%. The security returns mentioned above were unhedged; we also tested gross returns (i.e., not net of hedging costs) of our security selection method while hedging against greater-than-9% declines. When doing so with optimal puts, the average gross return was 12.08% over six months. The average gross return for the same securities when hedged with optimal collars capped at their potential returns was about half as much, 6.25%. This illustrates to what extent the average actual returns of the securities hedged with optimal puts were driven by outliers – securities that appreciated beyond our calculated potential returns. We adjust for the impact of potential outliers during the portfolio construction process, by only hedging with optimal collars when the net potential return is greater than 1.93x that of the same security when hedged with an optimal put (since 12.08/6.25 = 1.93). Backtesting The Hedged Portfolio Method To backtest the hedged portfolio method, we started searching for a hedged portfolio at each threshold on 1/2/2003. Hedged portfolios were run for six months, or until all positions had been exited, whichever came first, and then the ending dollar amount of the first portfolio was used as the starting dollar amount of the second sequential portfolio, and so on, until the end of our data series on 4/30/2014. When there were no securities available with positive net potential returns (usually, because hedging costs were too high), the last portfolio ending dollar amount was held as cash until the start of the next hedged portfolio. During those periods, we treated the cash as if it were held in a non-interest bearing account, so the dollar amount invested remains constant until the start of the next hedged portfolio. Within hedged portfolios, residual cash positions were treated as if they were invested in a money market fund, earning the yield prevailing at the time (during much of this time period, that yield was negligible). Within hedged portfolios, positions in underlying securities were entered at their unadjusted closing prices, with trading commissions of $7.95 deducted. To facilitate performance tracking, the dollar amounts allocated to these underlying securities were converted to the equivalent numbers of each security at its adjusted closing price on the start date of the portfolio. Underlying security positions were exited at their adjusted closing prices, with trading commissions of $7.95 deducted. During the simulation, to be conservative, puts were purchased at the closing ask price, and calls were sold at the closing bid price; options were exited at the midpoint of the closing bid-ask spread or their intrinsic value, whichever was higher (“last” prices weren’t used because in many cases with options, the last price might be weeks old). Each time options positions were entered or exited, a trading fee of $7.95 + $0.75 per option contract was deducted (the trading fees were the ones charged by Fidelity at the time). Results of the Hedged Portfolio Backtests In general, the higher the threshold was, the higher the CAGR was. CAGRs ranged from 3.26% at a 2% threshold, to 11.06% at a 22% threshold. Results at those thresholds and three other thresholds in between, and interactive graphs showing hedged portfolio holdings at each threshold during the backtesting period, can be found at this link . Disclosure: I/we have no positions in any stocks mentioned, and no plans to initiate any positions within the next 72 hours. (More…) I wrote this article myself, and it expresses my own opinions. I am not receiving compensation for it (other than from Seeking Alpha). I have no business relationship with any company whose stock is mentioned in this article.
Navigating Water ETFs

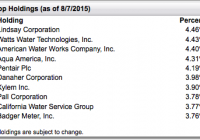
There is an impending water shortage, resulting in investment opportunities. Water ETFs provide a safer, albeit expensive, way to invest in the fragmented water industry. FIW has the best holdings, but a potentially very expensive fee structure. CGW offers nice global exposure to water investments and is my favorite of the four ETFs. PHO and PIO have a surprisingly strong emphasis on alternative energy. THE WATER OPPORTUNITY For several years I have followed an investing thesis I believe will significantly outperform the broader market: water. Water is essential to all forms of known life. Humans are particularly dependent on water. Without it we die within a week, and most die in three or four days. However, humankind’s uses for water extend way beyond drinking, or even household consumption such as cooking, bathing, or cleaning. Agriculture accounts for an impressive 70% of global water use; other vital industries such as mining , oil and gas , hydroelectric power, and general manufacturing are all highly water intensive. The dire water situation becomes even more evident when the future is taken into account. For one, shifting weather patters associated with climate change will likely cause dry areas to face more frequent and persistent droughts. Even more importantly, today’s global population is expected to jump from the current 7 billion people to 9 billion by 2040 . The extra 2 billion people on the planet, along with a rapidly growing global middle-class , will increase demand for water and the vital goods (food, energy, materials, and technology) it produces. With these facts in mind, let’s consider the global water situation . 97.5% of water is salt water in the oceans. Of the remaining 2.5% of water that is fresh, over half (~69%) is locked up in glaciers and snowpack. If global temperatures increase as expected over the next 85 years (between 2° and 11.5° F) , we can expect a significant amount of this fresh water to melt, flow into oceans, and become salt water. Of the ~0.8% of Earth’s water that is fresh and liquid, a significant amount is also polluted, especially in developing countries. So despite all the blue that you see on a picture of Earth from space, a generous estimate would render only about 0.67% of it immediately ready for human use, with several trends working to reduce that percentage even further. HOW TO GO ABOUT INVESTING IN WATER The water industry is very fragmented, meaning that investors should tread with caution-there is no “Exxon” of the water industry, where you can simply park your money with a dominant player. While there are many companies in this sector that I am very bullish on, the fragmented nature of the water industry makes it a prime candidate for ETF investments. In this article I will give my thoughts on the four water ETFs: First Trust Water Index (NYSEARCA: FIW ), Guggenheim S&P Global Water Index (NYSEARCA: CGW ), PowerShares Water Resources Portfolio (NYSEARCA: PHO ), and PowerShares Global Water Portfolio (NYSEARCA: PIO ). MEET THE ETFs FIW: This ETF is by far my favorite in terms of holdings and organization. First Trust gave FIW a strong weighting towards industrials (60%); Utilities account for 25% of the ETF, and IT, materials, and healthcare comprise the other 15% of the portfolio. I am particularly partial to this fund because Lindsay (NYSE: LNN ), my favorite play in the water industry, is its top holding. For those interested, last fall I wrote an article about Lindsay. PICO Holdings (NASDAQ: PICO ), which accounts for 1% of the fund, may raise some eyebrows because it is labeled as a financial. PICO is technically a financial (it is an insurance company), but it owns valuable water rights in Arizona and Nevada, hence its inclusion in the ETF. Source: First Trust I favor water ETF’s with strong industrial weightings, along with IT, materials, and health care, because these companies generally have reasonable OpEx and face very little regulatory oversight, meaning they are in prime condition to profit from investment in water infrastructure. On the other hand, water utilities have high OpEx and must have regulatory approval for rate increases. Granted, utilities provide income and stability, but my goal for water stocks is growth, rather than a bond substitute. This said, FIW’s organization provides some risk mitigation. Of FIW’s 37 holdings, none account for more than 4.5% of the portfolio, and none account for less than 1% of the portfolio (top 10 assets account for 41% of the fund). Almost all are American companies, and all trade on the NYSE or NASDAQ. (click to enlarge) Source: First Trust While there is a lot to like about FIW, it does have some flaws. For one, its dividend yield is only 0.74%. As I mentioned, I expect little in the ways for yield when investing in water, but a yield between 1%-2% would be better. FIW’s average daily trade volume of 57.5K is another potential red flag for investors, though PHO is the only other water ETF with a higher average volume. Finally, and most disappointingly, FIW will very likely assume a very high expense ratio. For the moment, its 0.59% expense ratio is actually the lowest of the four ETFs. However, the prospectus states that the true expense ratio is 0.84%, but that First Trust has agreements to keep the fees at or below 0.60% “at least through April 30, 2016.” Though it seems the fee reimbursement could continue beyond this date, investors need to be prepared for an almost 50% increase in the expense ratio within the next year. FIW trades 0.13% below its net asset value, so maybe the market has already factored in some degree of a discount. CGW: Guggenheim’s water ETF truly provides global exposure: only 38% of the fund is based in the US. The top domestic holdings are Pentair (NYSE: PNR ), Danaher (NYSE: DHR ), American Water Works (NYSE: AWK ), and Xylem (NYSE: XYL ). Global utility behemoths such as Veolia SA ( OTCPK:VEOEY ), United Utilities Group PLC, Severn Trent PLC, and Suez Environnement SA account for some of the top foreign assets. Although CGW has 50 holdings, it is weighted quite heavily towards the top holdings, as the top 10 account for 52% of the fund. I would prefer the allocation to be more diversified, but the majority of the top holdings fit the water theme very well (I consider IDEX a bit of a stretch, but understand Guggenheim reasoning of wanting to give water metering meaningful inclusion). Source: Guggenheim 40% of CGW’s holdings are in utilities, which is a higher percentage than I would prefer. However, the weighting towards utilities provides a nice counterbalance to the volatility that comes with investing in foreign companies. The utilities also strengthen the yield, which, for what amounts to a growth investment, comes out to a very respectable 1.75%. Unfortunately the dividend is paid yearly (on the last business day of the year), so the compounding power is reduced to annual compounding rather than quarterly. Another disappointing aspect to CGW is its low trading volume-it only averages 25.7K a day, so investors must be prepared for a relatively illiquid investment. CGW’s expense ratio of 0.65% is only slightly higher than FIW and PHO’s, but unfortunately it trades at 0.3% premium to its net asset value. This is cause for concern, but I do think that CGW deserves a premium due to its foreign holdings. Anyone who has owns foreign securities knows there is quite often an ADR fee and, quite possibly, taxes on foreign dividends. Finally, CGW owns securities that are otherwise difficult for Americans to own. For example take Guangdong Investments, which is a major provider of water in Hong Kong and China, but only trades on Hong Kong’s exchange. Finally, Schwab investors interested in water investments should give CGW a particularly close look. This is because CGW trades for free. I use Schwab, and the feature is wonderful-I have legitimately bought one share of CGW and it worked as advertised. This makes it easy to buy a few shares every payday without having to worry too much about trading fees or market timing. Out of all the options, I believe CGW to be the best. PHO: On the surface, PowerShares’ domestic water ETF seems to share a great deal in common with FIW. It has a small utility component (13%), is comprised of 35 holdings (vs. 37 for FIW), and is generally composed of industrial, life science, and materials companies. Because of this, like FIW, PHO is weighted more towards growth stocks, and has a very low dividend (0.60%). Source: Invesco However, a shallow dive into the holdings reveals a strong emphasis on energy. PHO has 15% of its assets in First Solar (NASDAQ: FSLR ) and SunEdison (NYSE: SUNE ); all together over 20% of the fund is devoted to renewable energy. Overall, I understand what PowerShares is aiming for-hydroelectric is entirely reliant on water, and oil and gas use and pollute water during extraction and refinement. Of course, PHO does have significant holdings in companies more closely related to water, such as Pentair, Ecolab (NYSE: ECL ), American Water Works, Xylem, and Valmont (NYSE: VMI ). That said, a 20% weighting in alternative energy seems like overkill to me. I would prefer to have higher weightings in desalination, filtration, pumping, irrigation, and metering, with 5-10% devoted to alternative energy. Additionally, given that the top 10 holdings account for 61% of the fund, I would favor a more balanced allocation to lower volatility and risk. Source: Invesco On the plus side, PHO’s expense ratio is a relatively reasonable 0.61%, which is slightly higher than FIW’s, but would be the lowest if/when FIW’s new fee program kicks in. As of now, PHO does not trade at any premium or discount to its net asset value. Perhaps most importantly, PHO’s daily trading volume averages 121K shares, giving it a huge advantage over FIW, CGW, and PIO in terms of liquidity. PIO: PIO is PowerShares’ international water ETF , and its 39 holdings resemble a blend of PHO and CGW. Like PHO, PIO has significant holdings in alternative energy, though the asset are limited to FSLR and SUNE, which account for 10% of the fund. Pentair, Veolia, Suez, and Severn Trent are a few major holdings in common with CGW’s. Source: Invesco Similar to CGW, PIO holds 33% of its assets as domestic companies; additionally, many of the foreign holdings overlap with CGW’s, though PIO’s exposure to the United Kingdom and France are noticeably higher. With utilities accounting for 45% of PIO’s holdings, it has the largest utility weighting of the group. Like CGW, this is a bonus for volatility, though given that people often view water as a fundamental right, I would be wary about putting too much money in utilities operating in left leaning countries. Fortunately for holders of CGW and PIO, many of these utilities, especially Veolia and Suez, are global companies that do business around the world, including the United States. Source: Invesco Despite PIO’s heavy utility holdings, it only yields 1.27%, though the strong dollar could be somewhat to blame for the muted dividend. PIO’s 0.76% expense ratio is very high, and it currently trades at a 0.1% premium to its assets. Additionally, PIO has very low liquidity, as its volume averages only 18.8K a day. Source: Investco CONCLUSION Much like individual water stocks, there are advantages and disadvantages to each of the ETFs. FIW’s holdings are by far my favorite, but if the new expense ratio rolls out, it will difficult to justify paying a 0.84% fee. Water ETFs already have high costs, and I would shy away from paying any more than necessary. At 0.76% cost ratio, PIO isn’t much better, leaving CGW and PHO as the “low fee” water ETFs. For me, PHO’s solar presence is too strong for my liking, though I may eventually buy some shares. PHO has strong liquidity, and I do like their thought processes behind the solar investments. CGW’s holdings are my second favorite behind FIW’s, and it pays an almost 2% dividend. That said, its current 0.3% premium is somewhat concerning, especially given that these specialty ETFs come with high expense ratios. Since I have a Schwab account, and can trade CGW for free, I have decided to pair CGW with individual water stocks. I will likely continue to slowly add to CGW until I reach a full position. I have no immediate plans to buy PHO, but will probably open a moderate position at some point. While there is no absolute winner, I think CGW is the best option. It offers both domestic and international exposure, is very “water focused,” has a reasonable fee structure, and pays the best dividend. That said, despite their underwhelming performance since their inceptions, I expect all of these ETFs to outperform the broader market over time. However, the high costs, low liquidity, and occasional bizarre holdings leave much to be desired. Hopefully as more investors look to invest in water, additional water ETFs with lower fees and higher liquidity will stream into the market. Disclosure: I am/we are long CGW, PNR, VEOEY, LNN, VMI. (More…) I wrote this article myself, and it expresses my own opinions. I am not receiving compensation for it (other than from Seeking Alpha). I have no business relationship with any company whose stock is mentioned in this article.