Tag Archives: stocks

CenterPoint Energy, Inc: Come For The Value, Stay For The Yield
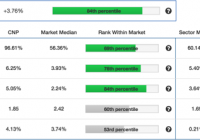
Summary Utilities sector is ready to rebound after a poor 2015. CNP has one of the highest dividend yields in the sector at 5.05%. Stock looks undervalued relative to the market and sector. Recent trends show positive investor sentiment. We rate CNP as outperform for the next 12 months. (The following article was written by Quantified Alpha contributing analyst Clement Kwong, CFA level 3 candidate.) Introduction CenterPoint Energy (NYSE: CNP ) is headquartered in Houston, Texas delivering energy and natural gas to approximately 25,000 customers across 20 states. CNP has a market cap of just over $8 billion, and has one of the highest dividend yields in the industry as well as the market. Given the mixed results we’ve seen from the latest economic data, a delay in raising rates could see investors search for income from dividend paying stocks. After being down almost 8% year to date, the utilities sector is experiencing a rally since June gaining over 6% during that time. CNP released Q2 earnings this week with mixed results. Although earnings of 19 cents were in line with analyst’s estimates, revenues of $1.5 billion missed analyst’s expectation of around $1.8 billion. On the positive side, operating income from electric transmission and distribution increased from $145 million in Q2 2014 to $158 million in Q2 2015 representing growth of about 9%. Management reaffirmed full year guidance of $1.00-$1.10 per diluted share while targeting a 4-6 percent growth in dividends and earnings through 2018. We believe CNP offers investors great value as well as one of the highest dividend yield in the market. Value Overview Taking a quantitative approach, our analysis looks at certain metrics that have a strong predictive ability. Historical back testing has shown that companies that rank in the top of these metrics have had excessive average return relative to the market. (click to enlarge) Source Our model output suggest CNP is quite undervalued when compared to the market and sector. With an earnings yield of 6.25%, CNP is trading at around 15X multiplies, well below the sector median of 18X. CNP also has a very impressive sales yield putting them in the 69th percentile of the market while boasting a solid free cash flow yield at 4.13%. Historical back testing has shown that on average, stocks with high cash flow yield have significantly outperformed stocks with low cash flow yield. As mentioned earlier, CNP also has one of the markets highest dividend yields at 5.05% putting them in “Dividend Channel’s” top 10 dividend paying utility stocks for 2015. Growth Overview After earnings almost doubled in 2014, first quarter earnings were down around 40% causing the stock to underperform relative to the sector. We believe the 16% drop in price over the last 12 months to be a great entry point for investors looking for an undervalued stock. With CNP’s improving return on equity and assets right in line with the market median, their ability to maintain growth in earnings will be important for investors to see that the company is going in the right direction. (click to enlarge) Source Sentiment Overview Investor’s sentiment has been positive as CNP’s short ratio has been fairly low at 1.89%. The low ratio indicates the low level of confidence in short sellers betting against CNP, suggesting a rally is in sight. We believe short interest is a good indicator of future returns due to short sellers having more information than retail investors. The positive sentiment is also supported by strong insider ownership. In May, the director and vice president bought up 12,000 shares suggesting that management is confident that the company will turn it around. Although there was little change in institutional ownership, the combination of a low short ratio as well as high insider ownership suggests that CNP is poised to outperform in the year to come. (click to enlarge) Source Outlook The effects of low commodity prices and milder weather have put downward pressure on the utility sector. As a result, utilities have been one of the weakest performing sector in 2015. With little relief in sight for commodity prices, it will be important for CNP to grow their customer base in electric transmission and distribution. Results from Q2 earnings show that CNP grew the number of metered residential customers by 2%, right in line with expectations. Due to limited competition in areas where CNP services, CNP should be able to offset weaker margins from its natural gas and energy business so long as its able to continue growing its customer base by 2%. The performance of CNP’s natural gas and energy line has been quite poor relative to previous years due to the low prices of oil and gas. With prices expected to stay low in the near term, CNP’s success in the electric transmission and distribution space will be essential for future success. We also like CNP because of management’s commitment to grow dividends over the next several years. A growing dividend will provide shareholders with return on their investment even when the stock is underperforming. After an extended period of price decline, we believe CNP is ready for a rebound. With solid fundamentals supported by positive investor sentiment, CNP has an attractive quantitative profile that should outperform the market over the next 12 months. Our equity pricing model uses historical back testing to predict the excess returns that a stock will generate. Using the CAPM model, we combine the stock’s calculated alpha with the stock’s beta to predict a range of 12-month target prices. Our base case scenario predicts a price target of $22.99 representing upside of 17% compared to Wall Street’s target price of $21.67 which represents upside of 11%. Our model projects with 75% probability that CNP’s stock price will be between $20.58-$24.33 over the next twelve months. (click to enlarge) Source Disclosure: I/we have no positions in any stocks mentioned, and no plans to initiate any positions within the next 72 hours. (More…) I wrote this article myself, and it expresses my own opinions. I am not receiving compensation for it (other than from Seeking Alpha). I have no business relationship with any company whose stock is mentioned in this article.
Low P/E Stock Of The Day No. 15: The AES Corporation

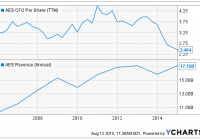
Summary Shares are currently trading at a P/E of 9.7x. Business are very stable due to contracts and low competition. However, the company has a poor record of asset allocation. In this series, I will select a low P/E stock to analyze. I define low P/E as anywhere from 5x to 10x, as any lower and we may be looking at special situations. Read the last edition here ! The AES Corporation (NYSE: AES ) is a diversified utility company whose operation spans across the globe. It has facilities in the U.S., Andes, Brazil, MCAC (Mexico, Central America, and Caribbean), Europe, and Asia. The company generates income from two lines of business, power generation and electricity distribution, this allows the company to capture profits across the value chain. Despite the company’s comprehensive offering, the stock meandered for years, and is currently trading at a TTM P/E of 9.7x. For an established and stable business, this is no doubt a low multiple. So is there a good justification? Stable Businesses The company’s power generation business currently sources from a variety of fuel types. Around 35% of the company’s plants are fueled by gas, 30% by coal, 29% by renewables, and 5% by oil, diesel, or petroleum coke. Evidently, the majority of the electricity is generated from environmentally friendly resources (natural gas and renewables), this is important as the governments around the world are imposing increasingly stringent environmental regulations. The power generation segment also operates on contracts. Although they are not decades long, the company’s average contract term is around 7 years, so they do provide stability in the medium term. The utility business primarily sells electricity directly to consumers (the power generation segment sells to corporate customers or other utility companies). This means that demand is not correlated to the general well-being of the economy, as consumers will use electricity no matter what. In addition, the company’s utility subsidiaries are often the sole distributors in their respective areas. This means that there is very little direct competition and it is unlikely that new entrants would want to compete with an established business that has already invested an enormous amount of capital on infrastructure. This provides a sustainable competitive advantage for the utility business. What I Don’t Like Despite revenue growth, the company has not been able to maintain the same level of profitability. This means that the management has not been keen on picking the right assets to invest in. In the graph above we can visualize the impact (or lack thereof) of growth. Over 10 years, revenue has risen 67% from $10.25 billion in 2005 to $17.15 billion in 2014. However, operating cash flow per share did not grow at all. This means that growth has not delivered any value to shareholders. In the chart below, we can see that the company has spent significant cash on various investments, which corresponds to the revenue growth. Without a corresponding rise in operating cash flow, I believe that the management is incapable of conducting proper asset allocation. Despite having a stable business, this alone makes me believe that the current P/E ratio is justified. Unless we see a management shakeup, I do not think that The AES Corporation would be a good investment. Disclosure: I/we have no positions in any stocks mentioned, and no plans to initiate any positions within the next 72 hours. (More…) I wrote this article myself, and it expresses my own opinions. I am not receiving compensation for it (other than from Seeking Alpha). I have no business relationship with any company whose stock is mentioned in this article.

A Well Designed High Yield Bond Fund: HYG

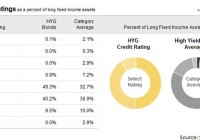
Summary The IShares iBoxx $ High Yield Corporate Bond ETF has the expected credit risk for a high yield fund, but the yield is worth it. The holdings show reasonable diversification in the debt securities in the portfolio. Maturities are scattered from 1 year through 10 years with the heaviest levels in the 5 to 7 year range. The correlation to SPY which causes the ETF to dip with the S&P 500 is a concern of investing in junk bond funds. The correlation issues should be less pronounced if investors include other (not junk, lower yield) bond funds in their portfolio. The iShares iBoxx $ High Yield Corporate Bond ETF (NYSEARCA: HYG ) is a solid bond fund for exposure to securities rated BB or B. As I’ve been searching for appealing bond funds, finding great ETFs for bonds of mediocre quality and higher yields has been difficult. After looking through the portfolio, I think the holdings are fairly reasonable for an investor wanting to regularly keep part of their portfolio in a bond fund. The holdings clearly don’t have impeccable credit ratings but they do offer investors a decent yield. The distribution yield is about 5.5% which means investors are actually getting some respectable income out a bond fund. Credit Quality When the name says “High Yield Corporate Bond”, investors should know that is going to mean that credit ratings won’t be very high. The allocation here seems within reason even if it is a little heavier on the specific ratings it targets than the category average. See the chart below: (click to enlarge) The concentration doesn’t bother me. If I’m going to invest in a credit sensitive bond portfolio I want the holdings to be diversified when considering the issuer of the debt, however having a heavy focus on the specific credit ratings is nice when an investor wants to build an entire portfolio and use multiple bond funds. Holdings I prepared the following chart showing the largest debt holdings of HYG. There were a couple equity holdings showing up but they were inconsequential to the overall portfolio as their combined value was significantly less than 1% of the portfolio. (click to enlarge) Maturities I grabbed another chart to show the maturity ranges across the portfolio: (click to enlarge) The maturity profile for the iShares iBoxx $ High Yield Corporate Bond ETF is fairly reasonable for an investor trying to get a solid diversification across the yield curve with a preference for shorter to medium length securities which should reduce the volatility of the portfolio. Of course, the credit risk on the portfolio could be an issue for some investors and may influence volatility in its own way. Regardless, the portfolio is showing almost no exposure beyond 10 years while having a solid yield. When it comes to maturities, I think this breakdown looks fairly solid. Risk HYG has been around since early 2007 which is wonderful for seeing how the fund did during that challenging period that followed. The shares did drop hard along with the market, which is not surprising given that they are investing in high yield (and thus higher risk) securities, however it did not fall even remotely as hard as the S&P 500. The biggest risk factor from a portfolio standpoint that came up for me was a 73.8% correlation in monthly returns with the S&P 500. Since one purpose of the bond portion of the portfolio is to provide diversification, it is a strike against junk bond funds that they tend to move with the market. That is a problem that should be impacting most junk bonds though, not a risk unique to HYG. Expense Ratio The one thing I really don’t care for is the expense ratio at .50%. I’m not going to say that this is terrible for a bond fund, but my expectations for low expense ratios are not met. Conclusion HYG is a fairly solid option for junk bond exposure. The portfolio appears to be designed well, the distribution of maturities works to help avoid excessive exposure to a single part of the yield curve and the portfolio produces a respectable amount of income. I could go for a lower expense ratio to really make this fund stand out, but that is the only weakness I see that is specific to the fund. If an investor is looking at the role of the bond fund in their portfolio, it would be wise to consider having multiple bond funds if the first one is going to be investing in junk bonds. This kind of fund can offer some diversification benefits to investors but it would be most productive in a portfolio that combines it with a few other bond funds with different duration exposures and higher credit ratings to enhance the diversification benefits that bonds bring to the investor’s portfolio. Disclosure: I/we have no positions in any stocks mentioned, and no plans to initiate any positions within the next 72 hours. (More…) I wrote this article myself, and it expresses my own opinions. I am not receiving compensation for it (other than from Seeking Alpha). I have no business relationship with any company whose stock is mentioned in this article. Additional disclosure: Information in this article represents the opinion of the analyst. All statements are represented as opinions, rather than facts, and should not be construed as advice to buy or sell a security. Ratings of “outperform” and “underperform” reflect the analyst’s estimation of a divergence between the market value for a security and the price that would be appropriate given the potential for risks and returns relative to other securities. The analyst does not know your particular objectives for returns or constraints upon investing. All investors are encouraged to do their own research before making any investment decision. Information is regularly obtained from Yahoo Finance, Google Finance, and SEC Database. If Yahoo, Google, or the SEC database contained faulty or old information it could be incorporated into my analysis.