Tag Archives: seeking

How Cash Can Boost Long-Term Returns
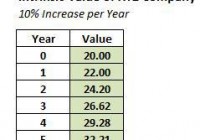
Summary Liquidity management is one of the most critical aspects of investment. Cash earns a 0% nominal return, but allows investors to take advantage of higher-return opportunities that may emerge. By holding more cash, one is betting that the purchasing power will increase at a future point. Moderation is key with holding cash; it’s rarely advisable to go to 100% cash or 0% cash. I’d recommend a cash position in the 20% – 40% range for most investors right now due to higher than average risks in the market. Buying stocks at depressed prices (i.e. with a large “margin of safety”) is the best way to generate superior returns over time. Cash, on the other hand, generates a 0% return. Absent a highly unlikely episode of hyper-deflation, you cannot become wealthy holding cash. In spite of this, I’d recommend holding 20% – 40% of your portfolio in cash right now. The reason for this is that there is value to liquidity, particularly in an inflated market environment. By holding cash, what you are actually doing is betting that the future value of your money in the market will be worth more than the present value. How can cash help you generate better returns? The key is to understand intrinsic value and the mathematics of investing. Intrinsic Value Price is what you pay for an asset. Intrinsic value is the fundamental worth of an asset. Therefore, an asset could be priced at $20,000, but have an intrinsic value of $30,000. In that instance, you are getting a bargain, because you are paying 33% less than the intrinsic value. In reality, it’s impossible to know the exact intrinsic value of a stock. None of us can see the future. Yet, we can come up with reasonable estimates of intrinsic value through a fundamental analysis of a company. That said, in order to explain why holding cash can be beneficial, we’ll first need to assume we can read the future. In this scenario, let’s say we know with absolute certainty that the intrinsic value of XYZ Company’s stock is $20. Now, we’re going to be able to live in five different alternate realities. In the first scenario, XYZ Company’s stock is selling at the depressed price of $5. In the second scenario, the stock sells at a still somewhat depressed price of $10. The third scenario will allow us to purchase the stock for $20; which is precisely the intrinsic value. In the fourth scenario the stock will sell at an inflated price of $25, and in the fifth scenario, it will sell at an even more inflated price of $30. Now, we’ll say that in each of our five alternate realities, we will purchase the stock and hold it for five years. We also know for a fact that the intrinsic value will grow 10% per year. You can see how the intrinsic value grows in the chart below. With that, let’s take a look at what happens. The Power of Compounding Now that we’ve created the set-up, you can see the return figures for all five scenarios below for a five-year holding period. It immediately becomes clear how dramatic the difference is between purchasing XYZ’s stock at a depressed price versus an inflated price. The “inflated price” only yields a 1.4% annual return, while the “depressed price” yields an astronomical 45.1% annual return! To put this further in perspective, if you started with $10,000 and generated a 45.1% annual return for the indefinite future, you would have $100,000 in a little over 6 years. On the other hand, if you generated a 1.4% for the foreseeable future, it would take you 166 years for you to turn that $10,000 into $100,000. That’s not a misprint! That’s the power of compounding. This is also the reason why an investor that generates a 17% annual return over 10 years is significantly better than one generating a 15% annual return. It may seem like a very small difference, but over a long-term timeframe, it really adds up. An investor making 15% annually on a $10,000 initial investment for 25 years would have $329,000 at the end of that timeframe. An investor generating a 17% annual return, on the other hand, would have $507,000; roughly 54% more. Why Cash is Valuable Given this math, it starts to become clearer why holding cash can sometimes led to higher long-term returns. Let’s say that XYZ’s stock was selling at the inflated price of $30, but you could see the future, and knew it could fall back down to $15 in 3 years. For simplicity’s sake, we’ll still assume that you plan to sell off at the end of Year #5 at the intrinsic value of $32.21. What would be your best option? (1) Buying the stock immediately and earning the 1.4% return for 5 years, (2) Holding cash for 3 years and then buying in at the semi-depressed price of $15 The answer is that option #2 is much more profitable. After five years, you’ll only generate a total return of 7.2% in Scenario #1, but you’ll achieve a 114.7% return in Scenario #2, in spite of the fact that you made a 0% return the first three years. This example showcases why the relationship between price and value are so important. It also shows why value investing works so well. What may seem like small differences in price can drive very large differences in return. Hold Some Cash Given the inflated market environment we are currently seeing, I believe it’s prudent to hold 20% – 40% of one’s portfolio right now. It’s true that you’ll likely underperform in the short-term (e.g. 1-3 years) as a result of this strategy. However, in the long-term, it makes more sense to take the 0% return now (on a part of your portfolio), and then use the liquidity to strike later when the returns become much more attractive. Of course, this should not dissuade you from taking advantage of bargains as you see them become available. And while I believe the broad market is overpriced, on a micro level, there will always be bargains out there. Yet, even if you can find a lot of bargains, I’d still recommend holding a good clip of cash, because even better bargains could become available the next time we find ourselves in a recession or a falling market environment. How much cash you hold in your portfolio depends upon your preferences and personal situation. If you’re in a situation where you can’t afford to lose much right now (i.e. you might need your cash for other purposes), I would recommend playing things fairly conservatively and holding a very large cash position. Even if you’re not worried about pulling out cash, I do think a minimum 10% cash position is prudent; and frankly, I wouldn’t dip below 20%. Conclusions Holding cash and generating a 0% return may seem like a poor option on the face of it, but once you understand the math behind returns, it makes a lot sense. By holding cash now, you’re hoping that you can generate higher returns in a future environment with lower prices. It’s never wise to go 100% cash, because at that point, you’re merely speculating. In an environment where stock prices seem inflated and there are few bargains out there, it makes sense to hold an elevated cash position in the range of 20% – 40% of your portfolio. On the other hand, in a depressed stock environment (such as the one we saw in late 2008 and early 2009), you should try to be as fully invested as possible, holding no more than 5% cash. Right now, I view us as being in an inflated environment and holding a 20% – 40% cash position is a prudent strategy. Your returns will lag in the short-term, but if there’s a market correction, you’ll more than make up for it in the long-term. This article appears in the February 2015 edition of Jake Huneycutt’s Contrarian Value Newsletter Disclosure: The author has no positions in any stocks mentioned, and no plans to initiate any positions within the next 72 hours. (More…) The author wrote this article themselves, and it expresses their own opinions. The author is not receiving compensation for it. The author has no business relationship with any company whose stock is mentioned in this article.
My Dividend Income Portfolio Update

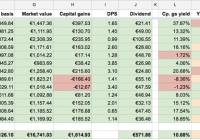
Six months ago , I decided to become a Dividend Growth Investor and become financially independent. Every month on the 8th and the 24th, I have invested €1000 in new stocks. If I keep this up, 15 years from now , my stock portfolio will grow large enough for me to be able to pay off all the monthly expenses with dividend income alone. On that day, my wife and I can retire. Today it’s February 16 . So how am I doing? Are we retired yet? Well, not yet. But my stock portfolio is doing very well. As of today, I am invested in 13 stocks with a market value of €16,741 . (click to enlarge) My portfolio is yielding a very healthy 14.46% (*) with a 3.78% yield on cost. The projected dividend for this year is €571.88, or €47.66 per month on average. (*) The total yield listed here is the sum of the capital gains yield and the yield on cost. This pretty much covers my gas bill, which is about €45 per month. So one way of looking at this income is to realize that for the entire year I will have free cooking and heating. Guess I don’t have to feel guilty about standing under the shower for more than 20 minutes. Let’s take a look at my last 3 purchases. Royal Dutch Shell (NYSE: RDS.A ) Shell caught my eye because of its high yield of 4.64% (one month ago) and low 13.8 P/E. It’s one of the cheaper high-yielding oil companies and provides me with a nice opportunity to raise the average dividend yield of my portfolio. Unfortunately, the dividend and earnings growth is not so good: respectively 2.21% and 4.56% . This is too low, as can be seen when calculating the Chowder number and Discount rate: respectively 6.49 (should be 12 or more) and 8.85 (should be 10 or more). Shell has a nice yield, but a very low dividend growth and not enough earnings growth to fund future dividend rises. So why go for this stock? I confess: I bought Shell partly out of nostalgia. My father worked at Shell for almost his entire career, and I have happy childhood memories of their bring your kids to work days at the KSLA building in Amsterdam. But another reason for buying Shell is that there is no indication that the company is in any kind of existential trouble. I take the long view and expect good results from this stock in the next 20-30 years, when worldwide oil reserves start to dry up. Oil prices will eventually rise again, Shell will flourish, and the company has a very good reputation of rewarding shareholders with dividend. I expect this stock to do fine. But it might take a few years. Philip Morris (NYSE: PM ) Now here is a stock with much better metrics. Philip Morris is the golden boy of many dividend growth investors right now. A 4.63% yield and a 17.29 P/E make this company an affordable high-yielder. But things get really interesting when looking at historic growth. PM has been growing its dividend at a healthy 18.38% (5-year CAGR), which contributes to an impressive Chowder value of 23.06 . But what about earnings? PM has got that covered too, with a 5-year EPS CAGR of 9.64% , which contributes to a discount rate of 14.32 . The DPR is 76.6% , which is in line with other tobacco companies. For example, British competitor BATS has a DPR of 74.3% . All metrics look good on this stock, and so I pulled the trigger and bought 14 shares. National Oilwell Varco (NYSE: NOV ) I bought NOV back in December at €55.90 per share, which gave me a dividend yield of 2.5%. One month later, the stock has dropped to a feeble €46.80. I lost 16% of my investment. Many people would panic at this point. Buying a stock and then seeing it drop in value is scary. You’re supposed to buy low and sell high, right? So when a stock drops after you buy, you need to get rid of it as quickly as possible, cut your losses, and try again. Actually, no. That’s a terrible strategy. At its new price, NOV has a yield of 3% , which is 0.5% higher than when I bought it. So if I buy more shares, the average yield of my NOV position actually rises to 2.75% , and I will receive €2.50 in extra dividend. This is called ‘averaging down’, and it is one of the golden rules of dividend growth investing. When the stock price drops, you buy more. Of course, this strategy fails completely if the company is going bust. So how are they doing? Well, fine actually. The 5-year DPS CAGR is an astounding 74.33% , and EPS growth a hefty 10.69% . This gives a Chowder value of 77.35 and a discount rate of 13.72 . And their DPR is only 23.50 , which is very low for an oil company. So there is more than enough earnings growth to finance NOV’s over the top dividend growth in the near future. In fact, my ranking formula places NOV just below Apple (NASDAQ: AAPL ). And remember, Apple has a 5-year dividend growth rate of 118.25% , which is just plain crazy. I don’t think you can go wrong with this stock. I bought 21 new shares. My portfolio today My portfolio today has a yield of 14.46% . The best-performing stock in my portfolio is Apple with a total yield of 39.97% . (click to enlarge) I rank my portfolio by ChowderDiscount (the sum of the Chowder number and the Discount value) and YDPR rank (which measures the spread between yield and payout ratio). My best ranking stock is Apple with a combined rank value of 2.61 . (click to enlarge) The market value of my portfolio today is €16,741 . (click to enlarge) My portfolio is well diversified over industry sectors, even though ‘Oil and gas’ is getting a bit large: I’m also diversified over three currencies. A good start, but it’s clear I need to buy more UK stock in the future:

Dissecting The Holy Grail Of Market Timing

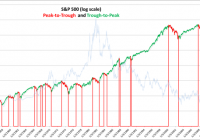
Summary Peak-to-trough drawdown periods represent approximately 27% of calendar days since 1950. Avoiding peak-to-trough drawdowns would have increased your returns by a factor of 2.12. Being short the market during drawdowns would have increased this to 3.23. Using up-capture and down-capture ratios are the best way to evaluate the effectiveness of market timing strategies. To successfully time the market, it’s best to have a quantitative system based on macroeconomic and fundamental variables, that is tested over many cycles and different interest rate regimes. Even good market timing strategies will underperform during bull markets and the amount of underperformance can be viewed as an insurance premium. By the numbers We first plot the peaks and troughs for the S&P 500. To be included as a peak or trough, the S&P 500 had to be equal to either its one-year high or one-year low to qualify. The S&P 500 had sixteen significant drawdown periods in the sixty four years from 1950 through 2014. This equates to a significant drawdown, on average, every four years. (click to enlarge) The 10-year constant treasury yield is shown in the background, scaled on the right hand side of the graph. Eleven drawdowns occurred in a rising interest rate environment and five in a declining rate environment. There were more frequent drawdowns in a rising rate environment, but the size of the drawdowns was more severe in the declining rate environment. The following table shows the returns for the sixteen peak-to-trough drawdown periods and trough-to-peak periods. The average drawdown was -26.3% and lasted 382 calendar days. The average trough-to-peak up return was 91.16% and lasted 1039 days. Peak-to-trough drawdown periods represent 27% of the calendar days. Note that these returns are based on daily closing prices and do not include dividends. The compound annual return excluding dividends for the 64 years was 7.76%. The next table shows a slightly different way of looking at the data that provides more granular detail, based on trading days, and provides an easy way to understand where the returns come from. It also avoids the distortion that comes from comparing equity curves that are dependent on start and end dates. The sum of the daily returns (yellow circle) for the 64 years is 482.16%, which equates to an average annual return of 7.53% – very similar to the compound return of 7.76% in the table above. The 482.16% was obtained by capturing 1020.25% in the trough-to-peak up-cycle and by giving up 538.09% in the peak-to-trough downturns. The second part of the table shows the detail for each of the 16 drawdown periods. Some highlights from this table: Drawdowns occur less frequently but are more extreme. The average daily return during drawdowns (-.13%) is 50% more extreme than the average daily return in an up-cycle (0.08%). “Stairs up, elevator down” is a familiar phrase. Avoiding the peak-to-trough drawdowns would have resulted in an average annual return of 15.94%, which is 2.12 times greater than the buy and hold average of 7.53%. Further, capturing the drawdowns by being short the market, could have increased returns by an additional 8.41% per year to 24.34%, 3.23 times greater than the buy-and-hold average. The volatility during drawdowns is not surprisingly higher at 1.26% versus 0.84%. Being short and being wrong, is not as bad as being long and being wrong – see matrix below. The goal of market timing is simple, even obvious: capture as much of the upside as possible and avoid as much of the downside as possible. If hedging on the downside, avoid more downside than you give up on the upside. It should also compensate for additional trading fees and taxes – if you are going to engage in market timing strategies, it’s best to utilize a tax deferred account. Measuring effectiveness Using up-capture and down-capture ratios enable us to evaluate other strategies against the buy-and-hold benchmark. From Investopedia: “The up/down-market capture ratio is used to evaluate how well or poorly an investment manager performed relative to an index during periods when that index has risen/dropped.” The traditional methodology for calculating up-capture and down-capture is to analyze it by month, year or rolling 3-year periods; we prefer to segment by peak-to-trough and trough-to-peak since it better captures all of the directional movement. We can also introduce another measure called the Total Capture Ratio, being the net returns relative to the sum of the maximum long and short returns achievable if we had perfect foresight. For example in our table above, our maximum possible capture would have been 1557.87% (1020.25% trough-to-peak, and 538.09% peak-to-trough). The actual buy-and-hold total was 482.16%, which represents 30.94% of the maximum possible capture. We can use this measure to compare to other strategies. Note: It is important to differentiate between market timing skills and stock picking skills, since they are distinctly separate. It is possible to have an up-capture ratio greater than 100% by picking stocks that outperform the index, but if we are only investing in the index per se, then the maximum possible up-capture ratio is 100%. In this article, we are dealing only with market timing and not stock picking, so 100% is the up-capture limit. Examining a 200-day moving average market timing strategy This strategy is common in the finance literature and goes long the S&P 500 when it is above its 200-day moving average, and to 100% cash when the S&P 500 is below its 200-day moving average. We use a two-day lag from signal to implementation. The results below show that overall the strategy is almost the same as the buy-and-hold strategy; 488.54% versus 482.16% for the sum of the daily returns. The strategy avoids a lot of the drawdowns (-169.60 versus -538.09% on the buy-and-hold) but also misses a lot of the up-capture (658.13% versus 1020.25% for the buy-and-hold). Factoring in transaction costs and taxes, it would likely be worse than the buy and hold. The volatility for this strategy is lower than the buy-and-hold (0.65% versus 0.97%) mostly due to avoiding the peak-to-trough drawdown periods, which are more volatile. The second part of the table showing the detail for each of the sixteen drawdown periods highlight this fact. Perhaps you are thinking it might be better with a different moving average period. Here are the results for a 100, 150 and 300-day moving average as well. The 200-day average still comes out on top, even though there really is no rationale to explain it. What if we go short, instead of going to cash, when the S&P 500 is below its 200-day average? The returns are very slightly better, but with higher volatility, so after adjusting for risk they are worse. Notice how we are positive in the drawdowns, but we now only capture 296.02% of the up-cycle returns. Comparing strategies in this format, it is easy to evaluate where the returns are coming from, how much are we giving up on the upside and how much are we avoiding on the downside, and what is the overall volatility? This was an example using a 200-day moving average strategy, but there are many varied strategies as described next. Types of Market Timing Strategies For a good overview of the different ways to time the market, see this article by famed professor Aswath Damodoran from NYU. He summarizes the different market timing approaches into the following five categories: Non-financial indicators, which can range the spectrum from the absurd to the reasonable. Technical indicators, such as price charts and trading volume. Mean reversion indicators, where stocks and bonds are viewed as mispriced if they trade outside what is viewed as a normal range. Macro-economic variables, such as the level of interest rates or the state of the economy. Fundamentals such as earnings, cash flows and growth. With few exceptions, only the last two can be considered for any type of market timing strategy that is based on cause and effect relationships. Since the first three have no cause and effect explanation they cannot be expected to perform over the long term; you may find periods when they seem to work, but you are hoping to get lucky. Here are our minimum criteria that a market timing strategy should meet, before being implemented: It must be based primarily on macroeconomic and fundamentals, with reasonable explanations for why there is cause and effect. It must be tested over many economic cycles and interest rate regimes, not just the most recent ten years. It must be 100% rules based, no emotional or discretionary overrides. Since it is based on historical returns or a back test, the incremental expected outperformance should cover the trading commissions, the potential taxes, as well as a strategy risk buffer. Our proprietary research has uncovered some meaningful results in back tests spanning forty five years, based on understanding the nature of the business cycle and how variables such as valuations, risk, interest rates and growth expectations, impact returns at different stages of the business cycle. The results implemented on the SPY ETF since 2001, including dividends , are shown here . As expected, the model has underperformed the buy-and-hold during the bull market of the past five years by about 2.5% per year, but since 2001, which includes two recessions, it has outperformed by significantly more. This is the nature of market timing strategies; expect to forgo some of the upside in bull markets but make it up, plus more, during downturns. The value of a market timing strategy is thus also a function of the frequency of significant drawdown periods. For example, as reported on CNBC , Brian Belski, chief investment strategist at BMO Capital Markets thinks we are 6 years into a 20-year secular bull market. If he is correct, then market timing strategies will likely underperform for the next 14 years. If historical averages are any indication, and a drawdown occurs on average every four years, then we are likely to see four more drawdowns in the next fourteen years, given that we have not had one since 2011. Or, consider that while interest rates may remain low for an extended period of time (by the end of the next 14 years it seems more likely they will be higher than today, given that they cannot go much lower) and that a rising rate environment may be conducive to greater than the average number of drawdown periods. Insurance You can think about it another way; think of the 2% you will likely give up every year in a bull market, as an insurance premium to protect the value of your portfolio. At current implied volatility levels, it would cost you about 7% per year to purchase at-the-money put protection on the S&P 500, so while a slightly different concept, a 2% premium seems reasonable, especially if it helps you avoid a 30% drawdown. Final thoughts If you don’t have the inclination or time to study how the market behaves, or have an advisor who does, then it’s best to stick with a simple diversified index strategy, but this is essentially a risk optimization strategy, so you should expect middle of the road results, with periodic drawdowns averaging around 30%. This may meet your needs, provided you don’t need to withdraw money during a drawdown, because that is difficult to recover from. It’s best to decide in advance whether you are going to try and exploit market timing. If so, then have a scripted, back tested plan and set it in place, but do not attempt to time the market on the fly, without a plan. Disclosure: The author has no positions in any stocks mentioned, and no plans to initiate any positions within the next 72 hours. (More…) The author wrote this article themselves, and it expresses their own opinions. The author is not receiving compensation for it (other than from Seeking Alpha). The author has no business relationship with any company whose stock is mentioned in this article.