Tag Archives: seeking

There’s Still Time To Lower Your Exposure To Riskier ETFs
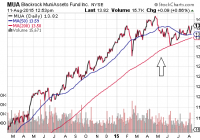
By itself, a “death cross” may not be particularly meaningful. However, when both the Dow Jones Industrials and the Dow Jones Transportation Average are flashing warning signs, stock valuations as well as risk preferences become increasingly important. As I have written previously, a tactical approach to asset allocation does not require that you abandon participation altogether. These tactical shifts will weather a hurricane, as well as permit me to raise risks at more attractive prices. A fair number of commenters, callers and perma-bulls were relatively tough on me in May when I suggested a strategic decision to raise cash levels . They were even tougher on me when I mentioned the possibility of picking up safer havens like intermediate treasuries via the i Shares 7-10 Year Treasury Bond ETF (NYSEARCA: IEF ) and intermediate-to-long duration municipal bonds via the BlackRock MuniAssets Fund (NYSE: MUA ). There’s no doubt about it… I was early on the call. Yet the idea behind raising cash as well as bolstering one’s allocation to investment grade securities (e.g., treasuries, munis, etc.) emanated from a well-reasoned interpretation of the data. At the corporate level, earnings growth had been waning, revenue had been contracting and non-financial companies had more leverage (37%) than they had back in 2007 (34%). At the macro-economic tier, wage increases had been flatlining, manufacturing had been crumbling and transporters in the iShares Transportation Average ETF (NYSEARCA: IYT ) had been dying a death by a thousand small cuts. Keep in mind, many had been dismissing the struggles of shippers, truckers, railways and airlines as irrelevant. After all, the big industrials were not tanking in the same manner as the big transporters. Until now. Industrial corporations – both in the Dow Jones Industrials average as well as the Industrial Select Sector SPDR ETF (NYSEARCA: XLI ) – have succumbed to the same technical pattern of weakness. Specifically, the shorter-term 50-day moving average has crossed over and below the longer-term 200-day trendline (a.k.a. “the death cross”). By itself, a “death cross” may not be particularly meaningful. However, when both the Dow Jones Industrials and the Dow Jones Transportation Average are flashing warning signs, stock valuations as well as risk preferences become increasingly important. Back in May and in June, valuations across nearly every metric of respectability had already reached the 2nd priciest in history (2nd only to the year 2000). Consider Buffett’s favorite indicator, market cap to GDP. As of this moment, the Wilshire Total Market Index market cap is roughly $21850 billion. That’s 123% of GDP. By this metric, the US stock market is only expected to annualize at about 0.3% with returns from dividends over the next decade. (See Market Cap To GDP chart below.) As I warned back in early June , investors would, at that time, need to monitor the market internals to gain perspective on risk-averse behavior. Risk-off behavior had not yet materialized completely. Here on August 11, the NYSE A/D Line’s 50-day trendline has not yet crossed over and below its 200-day moving average. It appears poised to make that transition. Yet equally concerning is the reality that the A/D Line itself had fallen below its 200-day for the first time since July of 2011 . Meanwhile, there have been a series of lower lows for the A/D Line since I first began highlighting market internals in May. Risk preferences – risk-taking versus risk-aversion – can be witnessed across a variety of measures and a variety of asset types. Indubitably, risk-aversion has the momentum, whether one is looking at recent relative performance of large-cap over small-cap, domestic over foreign, or investment grade credit over higher-yielding credit. Over the last two months, IEF has gained 3.1% whereas the iShares iBoxx $ High Yield Corporate Bond ETF (NYSEARCA: HYG ) has lost 1.7%. The demand for safety is trumping the risk of “junk.” One final sign that serves as a huge “yellow” caution: the S&P 500’s Advancing-Declining Volume Line (AD Volume Line). In essence, if the AD Volume Line is rising, there is significant strength behind advancing stocks. If it is falling, however, you have significant selling pressure behind the decliners. Right now, the S&P 500’s AD Volume Line isn’t just falling. Its 50-day moving average has fallen below its 200-day moving average for the first time since… yes, you guessed it… July 2011. By way of review, extreme valuations for equities have existed for the better part of a year. (Note: This can viewed a dozen ways at my “Don’t Party Like It’s 1999″ commentary.) Macro-economic weakness has been getting weaker, whether it is the lack of consumer spending, the breakdown in business spending, manufacturing woes, wholesale inventory buildups, export deceleration, slumping commodities, wage flatness and/or labor force participation. Micro-economic concerns may be summed up with earnings stagnation and the “revenue recession.” (Note: I discussed the “macro” and “micro” at great length at the end of July in “5 Reasons To Lower Your Allocation To Riskier Assets.” ) And market internals? Nearly every conceivable way that I’ve looked at them – from lack of breadth in equities, to missteps by leaders like Apple (NASDAQ: AAPL ) and Disney (NYSE: DIS ) to widening credit spreads to treasury demand – “risk-off” is garnering the limelight. As I have written previously, a tactical approach to asset allocation does not require that you abandon participation altogether. I have moved the bulk of my client base (over the last three months) from a 65% equity stake (e.g., domestic, foreign, large, small, etc.) and 35% income position (e.g., short, long, investment grade, higher yielding, etc.) to something that might resemble 55% stock (mostly large-cap domestic), 25% income (mostly investment grade) and 20% cash/cash equivalents. Cash today will reduce the adverse impact of significant price depreciation. The same can be said for larger domestic companies faring better in the storm than foreign companies or smaller corporations; similarly, investment grade should provide relief where higher-yield debt is likely to struggle alongside other riskier assets. In other words, these tactical shifts will weather a hurricane, as well as permit me to raise risks at more attractive prices. Additional evidence of market internals “rolling over” completely might encourage the use of other “risk-off” measures. For instance, 55% stock might be lowered to 40%, bolstering the overall cash stash to 35% (or one-third). Another possibility? Multi-asset stock hedging. My colleague and I created the FTSE Multi-Asset Stock Hedge Index (MASH) for those who wish to neutralize stock crises and stock bears without using leverage, options or shorting. Components of the index include ETFs like the PIMCO 25+ Year Zero Coupon U.S. Treasury Index ETF (NYSEARCA: ZROZ ), the PowerShares DB USD Bull ETF (NYSEARCA: UUP ), the CurrencyShares Swiss Franc Trust ETF (NYSEARCA: FXF ) and the iShares National AMT-Free Muni Bond ETF (NYSEARCA: MUB ). Click here for Gary’s latest podcast. Disclosure: Gary Gordon, MS, CFP is the president of Pacific Park Financial, Inc., a Registered Investment Adviser with the SEC. Gary Gordon, Pacific Park Financial, Inc, and/or its clients may hold positions in the ETFs, mutual funds, and/or any investment asset mentioned above. The commentary does not constitute individualized investment advice. The opinions offered herein are not personalized recommendations to buy, sell or hold securities. At times, issuers of exchange-traded products compensate Pacific Park Financial, Inc. or its subsidiaries for advertising at the ETF Expert web site. ETF Expert content is created independently of any advertising relationships.
Tactical Asset Allocation – My Ideas From 30 Years Of Learning

Summary How to create an investment portfolio using Tactical Asset Allocation. Three key measures I use are interest rates, valuation, and growth outlook. When selecting countries or regions, consider demographics, job growth, urbanization, debt levels, geo-political risk and currency effects. Tactical Asset Allocation (TAA) is defined as a dynamic investment strategy that actively adjusts a portfolio’s asset allocation . My goal in this article is to share with you the ideas that I have developed over the past 30 years, and to encourage discussion amongst readers, so as we can all learn from each other’s ideas and experiences. Introduction As a financial adviser, I must first consider a client’s risk profile. Younger clients with less capital invested will typically be prepared to take on more risk, and older clients will usually be comfortable taking on less risk. To keep it simple, I consider the following four asset classes: Cash, Bonds (CDs), Property and Equities. NB: I may also add Infrastructure (when interest rates are low to medium) or other sector funds, on occasion, as a small percentage of the portfolio. In determining my clients’ asset allocation, I consider the following factors: Interest rates Valuation Growth outlook Interest Rates The table below guides me, as does the 10-year Bond rate versus the equities dividend yield. BEST WORST Interest Rates Number 1 Number 2 Number 3 Number 4 Low (0-3%) Property Equities Bonds (CDs) Cash Medium (3-6%) High (6%+) Cash Bonds (CDs) Equities Property NB: The above % interest rates above are based on the reserve bank rate. Typically, the actual lending rates are around 2-3% higher. NB: When interest rates are “Medium” (3-6%), then their effect on the four asset classes is fairly neutral. Interest rates falling is better for bonds (CDs), property and equities. Interest rates rising is better for cash. Valuation My preferred valuation measures for asset allocation are: Price Earnings (P/E) Ratio : I look at a region or country’s P/E, both historical (last year’s earnings) and forward P/E, where available. My rule of thumb is to buy heavily as the P/E heads towards 10 and sell heavily as the P/E heads towards 20. A P/E of 15 is considered neutral. Having said that, I will also factor in interest rates. The Rule of 20 holds that P/E should be 20 minus the current interest rate. E.g., USA’s P/E should currently be 20 – 0.25 = 19.75. This makes allowance for times of extreme interest rates, as does the table below on interest rates. Long-term Charts of a Country’s Equity Index : Here, I simply view a 10- or 20-year chart and see if the index is above or below its trend line. Above being overvalued, below undervalued. Growth Outlook I will assess the following for a region’s or country’s growth outlook; GDP – Current year and forecast for next year. Earnings Per Share (EPS) – Forecast for next year. I will take a look at the following factors: Demographics – Is there a rising middle class, a growing work force or wealth effect? (You can read my article on demographics here , and the one on the rising Asian middle class here .) Job growth (unemployment) – Is the country gaining jobs? Urbanization – Is the country urbanizing? Debt levels – Are household debt levels low? Geopolitical risk and quality of government – Is there low geopolitical risk? Currency valuation – Is the currency undervalued? Trying to factor in all of the above is, of course, no easy task. Nor is it an exact science, but rather, is an art form, in my opinion. Having said that, I will give an example below of how I am currently (as of August 2015) recommending to my Australian clients, based on the above. Moderate-Risk Australian Client – $1m (AUD) Cash – 30% Bonds (Term Deposits, or TDs) – 0% Property – 20% Equities (comprising Asia) – 40% Sector funds – 10% (comprising Global Infrastructure – 5%, Global Resources – 5%) NB: TDs in Australia are the same as CDs in USA. Discussion on the above Tactical Asset Allocation Cash – 30% : Low percentage, as aggressive client and interest rates are very low. The reason to maintain 30% is to have cash available (to protect and invest) in case we see a severe market correction. Cash rates in Australia are still around 2.5% p.a. Bonds – 0% : Zero percentage, as interest rates are falling in Australia. 0% to International bonds, as the rates are already very low in developed markets. Could consider Asian or emerging market bond funds, where the rates are around 5-6% p.a., but there would be currency risk. Property – 10% in Australian-listed property : Low percentage due to earnings growth outlook being weak, with a weak Australian economy and rising unemployment. Low interest rates and fair valuation (P/E 15) suggest some exposure is necessary. Finally, most Australians already have very large $ exposure to an overvalued residential property sector. 10% in Global-listed property : Low interest rates are favourable and valuations fair. Equities – 40% : High percentage due to low interest rates, fair valuations in some regions/countries, strong growth prospects in Asia (demographics mostly good, rising middle class set to triple in size by 2020, according to DBS , with good jobs growth, urbanization, mostly low household and government debt levels, mostly low geo-political risk, and mostly good governments). Global Infrastructure – 5% : Low due to valuations being somewhat elevated. Could go to 10%, based on low global interest rates. Global Resources – 5% : Low, as this sector has been smashed down, and Asian demand for resources will pick up, with 290 million new homes required by 2020 and massive infrastructure projects planned. The valuations may look a bit high, but they are based on very low commodity prices at present. The following P/Es and growth outlook were part of the consideration. Australia: P/E – 15.67, Growth outlook – Poor Asia: P/E – 17.05, Growth outlook – Strong USA: P/E – 19.92, Growth outlook – Average-to-poor Europe: P/E – 19.11, Growth outlook – Average-to-poor Japan: P/E – 16.91, Growth outlook – Average-to-poor The above allocations will certainly lead to many debates, and this is healthy. US investors will naturally have more exposure to their local assets, which will avoid currency risk. They may choose to hold a percentage in US shares, given that the long-term outlook for US companies is strong. I do not disagree with that. My concerns are for non-US investors buying into the US late in the bull run, with a high valuation and a high USD. The main point of this article is to give investors some ideas on how they can go about building their portfolios, with consideration to both risk and return. For me, as discussed, I like to start with interest rates, then consider valuations and growth outlook. I always keep one eye on risk control and the other on optimizing returns, based on the client’s risk tolerance. Disclosure: I/we have no positions in any stocks mentioned, and no plans to initiate any positions within the next 72 hours. (More…) I wrote this article myself, and it expresses my own opinions. I am not receiving compensation for it (other than from Seeking Alpha). I have no business relationship with any company whose stock is mentioned in this article. Additional disclosure: The information in this article should not be relied upon as personal advice.

Baby Boomers: Cash Is NOT Trash

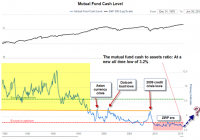
Summary Record low cash allocations exist in the market. Investors should use this as a contrary indicator and raise cash. Think safety first in a market this extended. With persistent, historically low interest rates, it’s no wonder people think ‘cash is trash’. Cash equivalents (Money market, U.S. government T-Bills, etc.) essentially yield nothing so it seems like a very logical place to avoid as one approaches, or has recently entered, retirement. But that’s exactly where we think you should be overweighting. It runs so contrary to most investors, which is precisely why it’s so actionable. Little thought exists to what happens if the stock market sells off and remains low for a long period of time. The only fear evident in the current environment is being underinvested and missing out on further gains (evident last week when the VIX hit 10.88, the third lowest reading since before the financial crisis). The nest egg many baby boomers have toiled for and nurtured is very vulnerable if positioned too aggressively, whether in a reach for yield scenario (junk-rated debt, MLPs, REITs, BDCs) or simply being fully invested, possibly even on margin, to buy solid ‘blue chips’. There is no shortage of scary commercials by asset managers insinuating that you’ll run out of money in retirement unless you’re fully invested (with them). Prudential’s (NYSE: PRU ) commercials come to mind (“How old is the oldest person you’ve ever known?)”. But a scarier one might feature someone trying to re-enter the work force in a few years whose portfolio’s value has been cut in half. Contrary to popular opinion, the stock market’s function is not to provide you with an income stream to live off of . Cash is not Trash But first, is there really an aversion to holding cash? Unequivocally, yes. Here’s two data points that bear out the aversion to cash: 1) The data we’ve seen in mutual funds corroborates this. There have been record lows in cash on a sustained basis with another new all-time low in the mutual fund cash ratio of 3.2% for June. This low demand for cash is remarkable and is one of several factors we believe portends a steep market selloff in the not too distant future. While it’s true that cash levels have been low for years now, we think a turn is imminent. A worrisome chart we came across from Acting Man illustrates the sentiment very well: (click to enlarge) In the chart above (we tweaked it a bit – we added the orange line, the yellow and pink shaded zones and the boxed labels with red arrows and try and put into context the severity of the current complacency) that for the entire period of the 1980s and most of the 90s (until the dotcom boom kicked in), cash levels were dramatically higher, ranging between 7%-12% versus today’s 3.2%. In fact, the ratio during the entire yellow-shaded range was also markedly higher than the 6% we saw during the panic at the March 2009 lows . To put things into perspective, the U.S. market capitalization was around $2 trillion near the beginning of the yellow shaded area and is now almost $25 trillion, according to Bloomberg . If cash levels even begin to return to these former (one might say ‘responsible’) levels, given the amount of money currently invested in our stock markets, there will be a severe shock to our economy and way of life. 2) We also see this by looking at retail accounts, where the money market ratio (assets in money market funds and not invested in the stock market) is a measly 2.47%, which is just off the all-time low of 2.45% earlier this year. Again, people are fully invested and probably reaching for yield. There has been an intensifying decline in the money market ratio over the last 4 years built on the dual pillars of extreme complacency and continued optimism. Many boomer retail accounts have been heavily invested in three sectors that have, unfortunately, probably all peaked – REITs (NYSEARCA: VNQ ), utilities (NYSEARCA: XLU ) and energy MLPs (NYSEARCA: AMLP ). We’ve been amazed at the amount of follow-on equity offerings (often overnight or ‘spot secondaries’) for energy stocks, often MLPs, over the last few years. This is a key source of financing for MLPs. We’ve already witnessed the carnage for high-yield bonds of the energy sector with the Shale collapse – when the appetite on the institutional side really disappears for their junk debt, these companies will be scrambling for capital even more than they are now. On the retail side, the retail investor’s powder is running dry, as it appears to be now given the above ratios, and the selling pressure should persist, especially as natural gas and crude oil should continue their slides. We see WTI getting back to the low $30s. Back to the Future Below is a great chart of the Dow Jones Industrial Average going back to 1900 (we added some data to try and give some perspective). In the early 1980s, everyone was in cash (and avoiding the stock market) when 3-month T-Bill rates were over 16%. The stock market had essentially gone sideways for about 17 years (1965-1982), investors were exhausted from the whipsaws and economic conditions (inflation) were terrible. People just wanted to be in cash. “Why risk it in a stock market going nowhere when we can get these high Treasury yields”? Eyeballing the chart above, mutual fund cash levels then were roughly 11% (versus 3% today). Completely logical thinking but also completely wrong. The market ascended around 14-fold over the next 17 years. (click to enlarge) Below is some monthly data from the St. Louis Fed on 3-month U.S. Treasury bill yields: A logical investor in 1982, seeing this data set above and the long-term Dow Jones chart, probably followed the Flock of Seagulls hit from that year and ‘Ran so far away…’ from the stock market. It is really amazing to see these numbers from the early 1980s, especially when compared to today’s yields: A logical investor in 2015, looking at the last two years of T-Bill rate data above, might say, “why would I put my money into this instrument that pays [essentially] nothing, when I can put it into the stock market that has been on fire for 6 straight years. There’s plenty of individual securities paying high single-digit returns, and the overall market yield is about 2% (which is 2% more than nothing) – I need the yield to live off of.” Sounds perfectly logical, but we think many investors are ignoring the risk side of the equation and only looking at the return side. A measly 2% market yield is unacceptable for a tremendous amount of market risk, in our opinion. We think these miniscule T-bill (or money market) rates are exactly where investors should be going at this point . From page 445 of Robert Prechter’s book , Conquer the Crash, from October 1998 through March 2008, the S&P 500 returned 3.84% while investments in U.S. T-Bills returned 30.22%. Today’s investors should be listening to ‘Timber’ by Pitbull and the message it portends. Safety with Benefits Here are three benefits for raising cash – 1) your capital will be preserved (at a time when markets look very frothy), 2) you have the potential for an increase in purchasing power if the deflation we’re seeing around the world hits here, which seems more likely than not and 3) you’ll reap the benefit of higher rates by rolling over whatever ultra-short term investments you’re in (T-Bills, money market funds, etc) and especially any floating rate securities the money market fund has. We want ‘cash’ in a money market fund that will hold up through a crisis or a sustained interest rate rise. Don’t forget, money market funds are portfolios of debt (shorter term and safer types, but debt nonetheless). You may even want to avoid a more traditional money market fund and opt for a lower yielding one that’s tilted towards very short-term Treasuries. But the government shutdown debacle in 2013 showed that there is risk involved in even that. ( Recall the yield on one-month T-Bills shot up from two basis points to sixteen in a week when there were very real worries of a default on short-dated T-bills). The dysfunction in Congress was serious enough that firms like BlackRock (NYSE: BLK ), JPMorgan (NYSE: JPM ) and Fidelity were scrambling to sell or reshuffle their securities (T-bills in the money market funds) that were most likely to be impacted by a default. So it might pay to ‘diversify’ with a couple different money market funds (preferably held at different brokerage accounts) if you have that option. There’s even some ETFs that try to achieve similar safety. Charles Schwab (NYSE: SCHW ) has the Short-Term U.S. Treasury ETF (NYSEARCA: SCHO ) which we prefer to Vanguard’s Short-Term Bond fund (NYSEARCA: BSV ) which is slightly longer in maturity and has commercial paper. Summing it Up Again, we like the idea of raising cash. Cash in a bank, referred to as ‘free cash’ at some institutions. Now if your assets are in a deferred retirement account, taking the money out would probably incur a tax liability (and possible penalties). So if you want to avoid that, liquidating perhaps one of the funds you have but keep the sale proceeds in the sweep account (presumably some type of money market fund). As long as it stays in the account, there won’t be any distribution so you’ll avoid tax or penalty as a result of that. If you have a defined contribution plan like a 401(k), you should have a few choices and look closely at the ones with the lowest yield. Lower yield money markets will probably have more of a short-term treasury component and less repurchase agreements, commercial paper and ‘asset’-backed securities which could become problematic in a crisis and certainly aren’t worth the risk for potentially another fraction of a percent in interest. By taking a portion of your money, if interest rates rise, you will benefit by rolling into higher and higher rates (given the short duration). We like the idea of putting at least a quarter of your portfolio into cash (or an equivalent) given these market levels. If you are adamant about not selling anything outright, one option could be simply taking the dividends you are getting in your funds and not reinvesting them – instead take them as cash and they’ll automatically go into the sweep vehicle or money market. If interest rates rise, you’ll benefit if you own ultra-short investments such as T-Bills since you’ll have the flexibility to roll over the investments as rates go higher. It appears more than likely that rates in the U.S. have bottomed and is being confirmed by the 3-month LIBOR. This should usher in a new era of rate increases worldwide. Raising cash on one-quarter of your portfolio plus hedging another quarter of your portfolio with the long-dated put option (an idea we highlighted in last week’s article ) could effectively cut your portfolio’s risk by half for the next almost 2 ½ years. As we’ve said before, we think now is a time to think independently and play defense with your portfolio and we look forward to the future when we can ‘back up the truck’ when things really go on sale. But that time doesn’t appear to be any time soon. Disclosure: I/we have no positions in any stocks mentioned, and no plans to initiate any positions within the next 72 hours. (More…) I wrote this article myself, and it expresses my own opinions. I am not receiving compensation for it (other than from Seeking Alpha). I have no business relationship with any company whose stock is mentioned in this article. Additional disclosure: I/we are not registered investment advisors and these ideas are not recommendations to buy or sell any specific security.