Baby Boomers: Cash Is NOT Trash
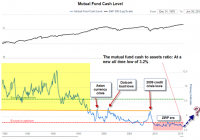
Summary Record low cash allocations exist in the market. Investors should use this as a contrary indicator and raise cash. Think safety first in a market this extended. With persistent, historically low interest rates, it’s no wonder people think ‘cash is trash’. Cash equivalents (Money market, U.S. government T-Bills, etc.) essentially yield nothing so it seems like a very logical place to avoid as one approaches, or has recently entered, retirement. But that’s exactly where we think you should be overweighting. It runs so contrary to most investors, which is precisely why it’s so actionable. Little thought exists to what happens if the stock market sells off and remains low for a long period of time. The only fear evident in the current environment is being underinvested and missing out on further gains (evident last week when the VIX hit 10.88, the third lowest reading since before the financial crisis). The nest egg many baby boomers have toiled for and nurtured is very vulnerable if positioned too aggressively, whether in a reach for yield scenario (junk-rated debt, MLPs, REITs, BDCs) or simply being fully invested, possibly even on margin, to buy solid ‘blue chips’. There is no shortage of scary commercials by asset managers insinuating that you’ll run out of money in retirement unless you’re fully invested (with them). Prudential’s (NYSE: PRU ) commercials come to mind (“How old is the oldest person you’ve ever known?)”. But a scarier one might feature someone trying to re-enter the work force in a few years whose portfolio’s value has been cut in half. Contrary to popular opinion, the stock market’s function is not to provide you with an income stream to live off of . Cash is not Trash But first, is there really an aversion to holding cash? Unequivocally, yes. Here’s two data points that bear out the aversion to cash: 1) The data we’ve seen in mutual funds corroborates this. There have been record lows in cash on a sustained basis with another new all-time low in the mutual fund cash ratio of 3.2% for June. This low demand for cash is remarkable and is one of several factors we believe portends a steep market selloff in the not too distant future. While it’s true that cash levels have been low for years now, we think a turn is imminent. A worrisome chart we came across from Acting Man illustrates the sentiment very well: (click to enlarge) In the chart above (we tweaked it a bit – we added the orange line, the yellow and pink shaded zones and the boxed labels with red arrows and try and put into context the severity of the current complacency) that for the entire period of the 1980s and most of the 90s (until the dotcom boom kicked in), cash levels were dramatically higher, ranging between 7%-12% versus today’s 3.2%. In fact, the ratio during the entire yellow-shaded range was also markedly higher than the 6% we saw during the panic at the March 2009 lows . To put things into perspective, the U.S. market capitalization was around $2 trillion near the beginning of the yellow shaded area and is now almost $25 trillion, according to Bloomberg . If cash levels even begin to return to these former (one might say ‘responsible’) levels, given the amount of money currently invested in our stock markets, there will be a severe shock to our economy and way of life. 2) We also see this by looking at retail accounts, where the money market ratio (assets in money market funds and not invested in the stock market) is a measly 2.47%, which is just off the all-time low of 2.45% earlier this year. Again, people are fully invested and probably reaching for yield. There has been an intensifying decline in the money market ratio over the last 4 years built on the dual pillars of extreme complacency and continued optimism. Many boomer retail accounts have been heavily invested in three sectors that have, unfortunately, probably all peaked – REITs (NYSEARCA: VNQ ), utilities (NYSEARCA: XLU ) and energy MLPs (NYSEARCA: AMLP ). We’ve been amazed at the amount of follow-on equity offerings (often overnight or ‘spot secondaries’) for energy stocks, often MLPs, over the last few years. This is a key source of financing for MLPs. We’ve already witnessed the carnage for high-yield bonds of the energy sector with the Shale collapse – when the appetite on the institutional side really disappears for their junk debt, these companies will be scrambling for capital even more than they are now. On the retail side, the retail investor’s powder is running dry, as it appears to be now given the above ratios, and the selling pressure should persist, especially as natural gas and crude oil should continue their slides. We see WTI getting back to the low $30s. Back to the Future Below is a great chart of the Dow Jones Industrial Average going back to 1900 (we added some data to try and give some perspective). In the early 1980s, everyone was in cash (and avoiding the stock market) when 3-month T-Bill rates were over 16%. The stock market had essentially gone sideways for about 17 years (1965-1982), investors were exhausted from the whipsaws and economic conditions (inflation) were terrible. People just wanted to be in cash. “Why risk it in a stock market going nowhere when we can get these high Treasury yields”? Eyeballing the chart above, mutual fund cash levels then were roughly 11% (versus 3% today). Completely logical thinking but also completely wrong. The market ascended around 14-fold over the next 17 years. (click to enlarge) Below is some monthly data from the St. Louis Fed on 3-month U.S. Treasury bill yields: A logical investor in 1982, seeing this data set above and the long-term Dow Jones chart, probably followed the Flock of Seagulls hit from that year and ‘Ran so far away…’ from the stock market. It is really amazing to see these numbers from the early 1980s, especially when compared to today’s yields: A logical investor in 2015, looking at the last two years of T-Bill rate data above, might say, “why would I put my money into this instrument that pays [essentially] nothing, when I can put it into the stock market that has been on fire for 6 straight years. There’s plenty of individual securities paying high single-digit returns, and the overall market yield is about 2% (which is 2% more than nothing) – I need the yield to live off of.” Sounds perfectly logical, but we think many investors are ignoring the risk side of the equation and only looking at the return side. A measly 2% market yield is unacceptable for a tremendous amount of market risk, in our opinion. We think these miniscule T-bill (or money market) rates are exactly where investors should be going at this point . From page 445 of Robert Prechter’s book , Conquer the Crash, from October 1998 through March 2008, the S&P 500 returned 3.84% while investments in U.S. T-Bills returned 30.22%. Today’s investors should be listening to ‘Timber’ by Pitbull and the message it portends. Safety with Benefits Here are three benefits for raising cash – 1) your capital will be preserved (at a time when markets look very frothy), 2) you have the potential for an increase in purchasing power if the deflation we’re seeing around the world hits here, which seems more likely than not and 3) you’ll reap the benefit of higher rates by rolling over whatever ultra-short term investments you’re in (T-Bills, money market funds, etc) and especially any floating rate securities the money market fund has. We want ‘cash’ in a money market fund that will hold up through a crisis or a sustained interest rate rise. Don’t forget, money market funds are portfolios of debt (shorter term and safer types, but debt nonetheless). You may even want to avoid a more traditional money market fund and opt for a lower yielding one that’s tilted towards very short-term Treasuries. But the government shutdown debacle in 2013 showed that there is risk involved in even that. ( Recall the yield on one-month T-Bills shot up from two basis points to sixteen in a week when there were very real worries of a default on short-dated T-bills). The dysfunction in Congress was serious enough that firms like BlackRock (NYSE: BLK ), JPMorgan (NYSE: JPM ) and Fidelity were scrambling to sell or reshuffle their securities (T-bills in the money market funds) that were most likely to be impacted by a default. So it might pay to ‘diversify’ with a couple different money market funds (preferably held at different brokerage accounts) if you have that option. There’s even some ETFs that try to achieve similar safety. Charles Schwab (NYSE: SCHW ) has the Short-Term U.S. Treasury ETF (NYSEARCA: SCHO ) which we prefer to Vanguard’s Short-Term Bond fund (NYSEARCA: BSV ) which is slightly longer in maturity and has commercial paper. Summing it Up Again, we like the idea of raising cash. Cash in a bank, referred to as ‘free cash’ at some institutions. Now if your assets are in a deferred retirement account, taking the money out would probably incur a tax liability (and possible penalties). So if you want to avoid that, liquidating perhaps one of the funds you have but keep the sale proceeds in the sweep account (presumably some type of money market fund). As long as it stays in the account, there won’t be any distribution so you’ll avoid tax or penalty as a result of that. If you have a defined contribution plan like a 401(k), you should have a few choices and look closely at the ones with the lowest yield. Lower yield money markets will probably have more of a short-term treasury component and less repurchase agreements, commercial paper and ‘asset’-backed securities which could become problematic in a crisis and certainly aren’t worth the risk for potentially another fraction of a percent in interest. By taking a portion of your money, if interest rates rise, you will benefit by rolling into higher and higher rates (given the short duration). We like the idea of putting at least a quarter of your portfolio into cash (or an equivalent) given these market levels. If you are adamant about not selling anything outright, one option could be simply taking the dividends you are getting in your funds and not reinvesting them – instead take them as cash and they’ll automatically go into the sweep vehicle or money market. If interest rates rise, you’ll benefit if you own ultra-short investments such as T-Bills since you’ll have the flexibility to roll over the investments as rates go higher. It appears more than likely that rates in the U.S. have bottomed and is being confirmed by the 3-month LIBOR. This should usher in a new era of rate increases worldwide. Raising cash on one-quarter of your portfolio plus hedging another quarter of your portfolio with the long-dated put option (an idea we highlighted in last week’s article ) could effectively cut your portfolio’s risk by half for the next almost 2 ½ years. As we’ve said before, we think now is a time to think independently and play defense with your portfolio and we look forward to the future when we can ‘back up the truck’ when things really go on sale. But that time doesn’t appear to be any time soon. Disclosure: I/we have no positions in any stocks mentioned, and no plans to initiate any positions within the next 72 hours. (More…) I wrote this article myself, and it expresses my own opinions. I am not receiving compensation for it (other than from Seeking Alpha). I have no business relationship with any company whose stock is mentioned in this article. Additional disclosure: I/we are not registered investment advisors and these ideas are not recommendations to buy or sell any specific security.