Tag Archives: seeking

What Is Portfolio ‘Risk’?

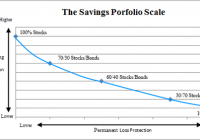
The idea of risk is a rather confusing and nebulous concept in modern finance. The traditional textbook definition of “risk” is standard deviation or volatility. This is convenient for academic purposes because it allows us to quantify risk in a portfolio. But this is a flawed concept for several reasons: Volatility isn’t always a bad thing. In fact, volatility with a positive skew is a good thing. No one complains about a portfolio allocation that rises 20% per year and falls 5% every once in a while, but this is a volatile position relative to many portfolios. Negative skew can be a good thing in a portfolio. For instance, many forms of insurance have a natural negative skew and detract from returns; however, it would be bizarre to argue that this is always a bad idea even if you don’t have to use the insurance. Investors don’t live in a textbook world and don’t necessarily judge their portfolios by the academic concepts that drive the way many portfolio managers assess their portfolio performance. This can create a conflict of interest between the investor’s perception of risk management and the asset manager’s perception of risk management. For most investors the “risk” of owning financial assets is not having enough financial assets when you need them. This arises primarily from two factors: Purchasing power risk. Permanent loss risk. Permanent loss risk occurs when your savings is declining in value and you’re forced to take a loss for some reason (emergency, behavioral, short-termism, etc.). Purchasing power risk is the potential that your savings does not keep pace with the rate of inflation. In order to visualize how one might protect against these risks in a portfolio, it’s helpful to view this concept on a scale showing how our savings can be allocated across different assets: The investor who wanted to be protected against permanent loss risk would be 100% cash; however, they would risk falling behind in purchasing power by the rate of inflation each year. Likewise, the investor who wanted to be protected against purchasing power risk would be 100% stocks. A balanced portfolio will tend to protect against these risks somewhat evenly and in my experience investors tend to be more worried about protecting their savings from permanent loss than Modern Finance often implies. Viewing the world through the lens of this Savings Portfolio Scale will provide investors with a much more realistic and balanced perspective of how market risk applies to their actual savings. Share this article with a colleague

Is The USDA Right About Cotton?

Summary The most recent report shows a 20% decline in production. Crude oil remains near 6 year lows. Global stocks are shrinking, but not by much. October is peak harvesting season for cotton. This article will center around the recent United States Department of Agriculture (USDA) projections on cotton and the subsequent affect that could have on the iPath Dow Jones-UBS Cotton Total Return Sub-Index ETN (NYSEARCA: BAL ). During our last article on BAL, which you can read here , we discussed how oil and cotton shared a correlation. We will revisit that discussion and end with an analysis of current conditions. USDA For the full context of what we are going to discuss in this article, here are the links to the USDA’s August crop production and world markets and trade circulars for cotton. I highly recommend viewing the links as we will not cover the global supply and demand factors in this article (except for a summary in the conclusion). (click to enlarge) Chart obtained from the USDA. The above chart explains the recent increase in cotton prices. United States production is projected to be down almost 20% over last year. The keyword I want to highlight here is projected. See below for a more detailed view of the projections: (click to enlarge) Chart obtained from the USDA. The reason I was highlighting the word “projected” is because some Texas farmers were on record saying that they believe the numbers for abandonment are way off. These farmers are part of a coalition that represents 60% of the states production. Abandonment is when farmers plant the crop, but do not harvest it due to low market prices or other market conditions. If this had been a farmer from New Mexico, no one would pay attention. However, Texas is the largest state for U.S. cotton production, by a long shot. Earlier this year we discussed how the flooding there delayed the planting but farmers were still expected to get a full harvest in. Bottom line from this report is that yield per acre is down a bit and the number of planted acres is down significantly. The conclusion I come to is that even if Texas farmers have lower abandonment numbers, they will not be able to completely overcome the overall drop in yield and planted acreage. BAL Let’s view the price action of BAL over the last month: (click to enlarge) Chart obtained from Optionshouse.com Here is another view showing the percentage of change: BAL has been hampered by the continuing decline in crude oil prices. See the crude chart below: I have been in the camp that crude oil is going to rebound to about $60 per barrel by the end of the year. I had sold a few Puts on The United States Oil Fund (NYSEARCA: USO ), but bought them back recently for a small loss. Given the current supply and demand factors and market factors, I don’t know if we will see $60 by years end. Saudi Arabia seems bent on eliminating competition, Iran is coming online, U.S. production has not slowed drastically, and demand has not increased substantially. The U.S. dollar is a wild card with a projected Fed liftoff this September. A stronger dollar means additional pressure on oil. How is all of this affecting BAL? Cotton will face continued price pressure from cheap oil. This presents the case more for a ceiling on spot prices than a floor. I suspect it was the lower prices of crude that swayed farmers to plant more profitable crops this year than the lower spot price of cotton. Oils first plunge this year came right before peak planting season for cotton. Conclusion In closing, I believe the USDA’s numbers and projections are more in line with reality than the Texas farmers are leading you to believe. However, if the farmers can obtain a more reasonable rate for their crop, then naturally abandonment will decrease, further increasing supply. The global supply and demand of cotton remains stable. Stocks are still trending lower off of their all-time highs but are still not being reduced enough to make a substantial impact on the spot price of U.S. cotton and in turn BAL. I would use caution with this current spike in spot prices. I do not see this a buy signal. Given the current state of crude prices, I see higher risks to the downside for cotton going forward. I would keep an eye out for the September USDA reports to see if their current projections hold or are revised. If the Texas farmers are correct about the abandonment, then I see higher than projected production and further downward pressure on spot prices. This would have the opposite effect of the nice green candle you see in the chart above. By November, I hope to have a full report out for you on my 2016 outlook for cotton. I see 2016 as a more profitable year for BAL as lower cotton production reduces supply and we finally see a rebound in crude prices. Crude remains a wild card and anything can happen with the flick of a Middle Eastern switch. If you are investing in BAL your current focus should be the monthly USDA reports (and any other production news) and crude. As we enter peak harvesting season for cotton, those monthly reports are very valuable. As always, I appreciate you reading and I hope you have a profitable end to 2015! Disclosure: I/we have no positions in any stocks mentioned, and no plans to initiate any positions within the next 72 hours. (More…) I wrote this article myself, and it expresses my own opinions. I am not receiving compensation for it (other than from Seeking Alpha). I have no business relationship with any company whose stock is mentioned in this article.

It’s Better With Beta

The title of Larry Swedroe’s latest book, The Incredible Shrinking Alpha, raises a question: what happened to the idea that skilled managers can consistently beat the market? In a recent interview with Swedroe, we discussed the idea that this ability hasn’t really disappeared: it’s just that “alpha has become beta.” What exactly does that mean? In investing jargon, alpha is the name given to the excess return a fund manager achieves through skill. Beta , on the other hand, refers to the returns available to anyone who is willing to accept a known risk. When Swedroe says “alpha has become beta,” he simply means that anyone who understands how to structure a portfolio can increase their expected returns by simply changing their exposure to specific types of risk, known as “factors.” A factor is a characteristic of a stock that affects its expected return and risk. Factor investing (sometimes marketed as “smart beta”) means identifying which of these characteristics might predict higher returns in the future-even if it also brings more risk-and then building a diversified portfolio that captures those returns in a systematic way, without resorting to picking individual stocks. And then there were three As I’ve written about before , the so-called Fama-French Three Factor Model was a revolution in investing. In a landmark 1993 paper , Eugene Fama and Kenneth French argued that the vast majority of a stock portfolio’s returns could be explained not by the manager’s genius, but by its exposure to beta (market risk), small-cap stocks (which are expected to outperform large caps over time) and value stocks (companies with low prices relative to fundamentals such as book value, dividends and earnings, which tend to outperform growth stocks). But it didn’t end there. Later in the 1990s, a fourth factor was identified: momentum , or the tendency for stocks that have recently performed well (or poorly) to continue in the same direction. In the last few years, researchers have identified several more. First was the profitability factor : companies with a high ratio of gross profits to assets tend to outperform, even though these are generally growth stocks, not value stocks. That was followed by the investment factor , which is based on the counterintuitive idea that capital expenditures on new acquisitions and ventures usually fail, and therefore lead to lower stock returns in the future. The factor zoo If you this all sounds overly complicated, you’re not alone in that opinion. One finance professor famously described the “zoo of new factors” now in the academic literature. “Something like 300 factors have been identified,” Swedroe says. “Because there is a big premium on being published, you want to be the professor who finds a factor: then you can go and get a job on Wall Street.” One commentator reported that “some quant shops now use an 81-factor model to build equity portfolios.” The good news, says Swedroe, is that no one needs anything close to an 81-factor portfolio. “The thing to understand is that some of these factors are really just manifestations of some other factor,” Swedroe says. In a new paper , Fama and French acknowledge that once you consider beta, size, value, profitability and investment, none of the other factors have any meaningful explanatory power. (This idea is discussed in the final appendix to The Incredible Shrinking Alpha .) Five is enough In our interview, Swedroe used an analogy to explain why simple portfolios get you most of the way there. “Say you’re taking a drive across Canada, and it’s 3,000 miles. And let’s say that during each leg of your journey you drive halfway. So the first leg you drive 1,500 miles, and the next leg you drive 750 miles, and so on.” You make progress every day, but each successive leg of the journey has less of an impact. “It’s the same thing with a portfolio: if you add bonds to a stock portfolio, that’s a big move. Then you add international stocks, and that’s a pretty big move too, though not as big as adding bonds. Then you start adding small-cap and value. Once you’re at that eighth or ninth asset class, yes, you will pick up something, but you’re already most of the way there. So we want to focus on the factors that really matter the most: the ones with the big premiums, as well as the ones that help diversify. And I think the literature is pretty clear now that we’ve got these five.” Swedroe also points out that more factors may mean fewer stocks. “If you keep adding screens, what happens is you get a less and less diversified portfolio. You could start out with a small-cap portfolio that is 2,500 stocks, and then you make it small-value and you’re down to 1,500. Add another screen and you’re down to 700. At some point you don’t have enough of a diversified portfolio. So you have to make decisions about how to do this.” One decision might just be to stick to a plain-vanilla Couch Potato strategy. In fact, if you’re a DIY investor you probably should . Factor investing may be able to increase your returns slightly over the long term, but only if you have the expertise to manage a more complicated portfolio. Consider it the icing, not the cake itself .