Tag Archives: seeking-alpha

Finding Value With The Piotroski F-Score Part 2

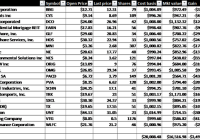
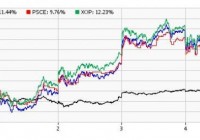
Summary The Piotroski F-Score was designed to find companies that are cheap and recovering. In part one 20 companies were picked out that met the Piotroski F-Score criteria. Part two takes a look at how they have performed over the past two months. This is the second in a series of articles looking at the investment performance of the Piotroski F-Score over the space of year. You can find the first part of this series, which explains the methodology behind the F-score, as well as an initial summary for each company, here . Finding value The F-Score was designed to hunt out value opportunities that are profit-making, have improving margins, don’t employ any accounting tricks and have strengthening balance sheets . However, as usual, this strategy cannot be employed alone, it needs to be combined with another screening tool to produce a suitable set of results. One point is awarded for each criteria the company passes and the stocks that score the highest, eight, or nine are regarded as being the strongest candidates for recovery. Piotroski recommended scoring the bottom 20% of the market in terms of price to book value and then working from there. Using the following system, Piotroski’s April 2000 paper Value Investing: The Use of Historical Financial Statement Information to Separate Winners from Losers, demonstrated that the Piotroski score method would have seen a 23% annual return between 1976 and 1996 if the expected winners were bought and expected losers shorted. In this series of articles I’m testing the F-Score, as both a way to discover value stocks and trade them without fundamental analysis, the screening criteria and investments are based purely on the financials. 20 companies have been selected, those that both meet Piotroski’s criteria and were, at time of initial investment, trading below book value per share. I’ve made a slight change to the assessment since publishing part one. In part one I noted that the stocks in the portfolio would be sold after they reverted back to a P/B value of 1. However, I’ve now changed the criteria to more closely reflect Piotroski’s test and the stocks will be sold after one year. The companies that met all of criteria were: Noble (NYSE: NE ), Ternium SA (NYSE: TX ), Unit (NYSE: UNT )Ocean Rig (NASDAQ: ORIG ), CYS Investments (NYSE: CYS ), Pacific Drilling (NYSE: PACD ), Hornbeck Offshore Services Inc (NYSE: HOS ), OM Inc. (NYSE: OMG ), Speedy Motorsports (NYSE: TRK ), Gulfmark Offshore Inc (NYSE: GLF ), Schnitzer Steel Industries Inc (NASDAQ: SCHN ), Bill Barrett (NYSE: BBG ), Penn Virginia (NYSE: PVA ), Steel Excel Inc (OTCQB: SXCL )McClatchy Co (NYSE: MNI ), Ducommun Inc (NYSE: DCO ), Vantage Drilling Co (NYSEMKT: VTG ), Nuverra Environmental (NYSE: NES ), Willis Lease Finance (NASDAQ: WLFC ) and Ellington Residential Mortgage (NYSE: EARN ). Current performance How has the portfolio performed to date? (click to enlarge) (click to enlarge) Values taken just after close of trading 02/05/2015 The portfolio has a hypothetical $1,000 invested in each company, excluding commissions. These positions are based on financial data only, there’s no weighting to fundamental factors. Unfortunately, the portfolio is overweight oil, so has been pushed down in line with the oil price over the past two months. The stand out performers were Ducommun Inc, up 13%, OM Group, up 9.2% and Speedway Motorsports Inc., up 16.3%. The dogs of the portfolio so far have turned out to be Nuverra Environmental, down 58%, Pacific Drilling, down 43.8% and Vantage Drilling, down 42.35% during the period. Overall, since inception the portfolio has fallen 17.9%, losing $3,578.57. I’m tempted here to provide some commentary on how the company’s have performed and why they have performed as such but that’s not the point. The Piotroski F-Score is designed to be used with financials only and no fundamental analysis. Editor’s Note: This article covers one or more stocks trading at less than $1 per share and/or with less than a $100 million market cap. Please be aware of the risks associated with these stocks. Disclosure: The author has no positions in any stocks mentioned, and no plans to initiate any positions within the next 72 hours. (More…) The author wrote this article themselves, and it expresses their own opinions. The author is not receiving compensation for it (other than from Seeking Alpha). The author has no business relationship with any company whose stock is mentioned in this article.

Can Energy ETFs Regain Fervor On Capital Spending Cuts?

After a seven-month wild run, oil and energy stocks have bounced back strongly in recent sessions following the slew of capital spending cuts by several major players in the industry. This move, along with the latest data that a number of U.S. oil drilling rigs fell the most in 30 years last week, propelled the oil prices higher. In fact, both the crude and Brent surged about 20% in the four days till Tuesday, marking the longest winning streak since January 2009. However, oil price again reversed its four-session rally, dropping 8.7% yesterday after U.S. crude inventories jumped to a record high last week. Notably, crude is currently hovering around $50 per barrel while Brent is trading at over $55 per barrel. Spending Cuts at a Glance A large number of firms whether domestic or international have slashed their capital spending for this year in order to conserve cash balance for dividend payments. The second largest U.S. oil giant Chevron (NYSE: CVX ) trimmed its capital spending by 13% to $35 billion for this year while ConocoPhillips (NYSE: COP ) cut its spending by an additional 15% after reducing it 20% in December. Occidental Petroleum (NYSE: OXY ) reduced its capital spending by 33% to $5.8 billion for this year. European oil majors also followed suit. BP plc (NYSE: BP ) announced spending cuts by 20% to $20 billion for this year from the previous guidance of $25 billion. Royal Dutch Shell (NYSE: RDS.A ) plans to cut capital spending by $15 billion over the next three years while Total SA (NYSE: TOT ) trimmed its capital expenditure by 10% for this year. Further, the Chinese oil major CNOOC (NYSE: CEO ) slashed its capital spending by as much as 35% for this year and Russian oil major Gazprom ( OTCQX:GZPFY ) reduced it by $8 billion. Brazilian state-run energy giant Petroleo Brasileiro S.A. (NYSE: PBR ) or Petrobras also lowered its capital expenditure budget to $31-$33 billion from $44 billion. The efforts taken by these oil giants will likely curb oil production and reduce global supply, and thereby lead to higher oil prices. Market Impact Driven by a slew of investment cut plans, energy stocks and ETFs have made an impressive comeback and are easily crushing the overall market by wide margins over the past five days. In particular, SPDR S&P Oil & Gas Exploration & Production ETF (NYSEARCA: XOP ) , First Trust ISE-Revere Natural Gas Index Fund (NYSEARCA: FCG ) and PowerShares S&P SmallCap Energy Fund (NASDAQ: PSCE ) gained the most surging in double digits in the same period. Below we profile these ETFs in detail and discuss some of the specifics behind their recent rally: XOP This fund provides equal weight exposure to 83 firms by tracking the S&P Oil & Gas Exploration & Production Select Industry Index. Each holding makes up for less than 2.2% of the total assets. XOP is one of the largest and popular funds in the energy space with AUM of $1.9 billion and expense ratio of 0.35%. It trades in heavy volume of more than 10.4 million shares a day on average. FCG This fund offers exposure to the U.S. stocks that derive a substantial portion of their revenues from the exploration and production of natural gas. It follows the ISE-REVERE Natural Gas Index and holds 28 stocks in its basket that are well spread out across each component with none holding more than 6.05% of the assets. The fund has amassed $272.7 million in its asset base while charging 60 bps in annual fees. Volume is good with more than 942,000 shares exchanged per day on average. PSCE This fund provides exposure to the energy sector of the U.S. small cap segment by tracking the S&P Small Cap 600 Capped Energy Index. Holding 35 securities in its basket, it is concentrated on the top five firms that make up for 37.9% share. Other firms hold less than 5.4% of total assets. The fund is less popular and less liquid with AUM of $28.6 million and average daily volume of about 24,000 shares. Expense ratio came in at 0.29%. Other energy ETFs were also in deep green over the past five trading sessions. Some of these include IQ Global Oil Small Cap ETF (NYSEARCA: IOIL ) , First Trust Energy AlphaDEX (NYSEARCA: FXN ) , Market Vectors Unconventional Oil & Gas ETF (NYSEARCA: FRAK ) and PowerShares Dynamic Energy Exploration & Production ETF (NYSEARCA: PXE ) . All these are up in upper single digits. What’s In Store? The rally in the energy ETFs seems to be short lived as reduced investments will likely cut supply in the long term and short-term supply with remain intact. As per the latest EIA report, the U.S. crude stockpiles rose 6.3 million barrels in the week (ended January 30), much higher than the market expectation of a 3.7 million barrel increase. Total inventory came to 413.1 million barrels, representing the highest level in at least 80 years. The current threat facing the U.S. oil industry is the strike in the U.S. at nine refineries by the United Steelworkers union. This is the biggest strike since 1980 and will likely curtail crude processing adding to the supply glut. It could affect 10% of the U.S. refining capacity and if the strike turns to be a full-blown crisis, it could threaten about two-thirds of the total refining capacity, indicating more pain for the commodity and the energy stocks.

Apple And IBM Enter The PowerShares Buyback ETF

Apple and IBM are now holdings of PKW. 5% of shares outstanding was the key cutoff line. These two tech heavyweights represent more than 10% of the ETF. Additions should make this growing ETF more popular. When investors look at exchange-traded funds, there are a number of choices out there. You can buy an index ETF like the SPDR S&P 500 (NYSEARCA: SPY ), a sector ETF like the Energy Select Sector SPDR (NYSEARCA: XLE ), or even a country fund like the iShares MSCI Germany (NYSEARCA: EWG ). There are certainly ETFs for everyone, and there are even many specialty ones. One of my favorite ETFs is the PowerShares Buyback Achievers Portfolio ETF (NYSEARCA: PKW ), an exchange-traded fund that buys stock in companies that are buying back stock, and lots of it. I’ve written about this ETF a couple of times, and today I’m here to write about it again. My first article on PKW was in regards to a major shakeup that could come involving technology giant Apple (NASDAQ: AAPL ). As many investors know, Apple has an extremely large share repurchase plan in place. Well, PKW has just done its annual reconstitution, and Apple and tech giant IBM (NYSE: IBM ) are now holdings in this ETF. Today, I’ll look at what that means for both stocks, as well as PKW. For those that have not heard of this ETF, please see the above-linked article for the complete description. The main idea is to include companies that have bought back at least 5% of their outstanding shares over the past twelve months. The fund is reconstituted every January and rebalanced four times a year. Apple recently announced a tremendous quarter highlighted by nearly 75 million iPhone sales. The strength of the phone and other products has allowed Apple to spend more than $70 billion on its buyback in the past couple of years. Last year, Apple missed out on inclusion in this ETF, but in the past twelve months, the share count has come down by more than 6%. IBM has also been buying back a tremendous amount of shares, and it is the third-largest holding in the fund. In the table below, you can see the other top ten holdings, which include Home Depot (NYSE: HD ), Boeing (NYSE: BA ), Twenty-First Century Fox (NASDAQ: FOXA ), Lowe’s (NYSE: LOW ), Time Warner (NYSE: TWX ), Express Scripts (NASDAQ: ESRX ), Monsanto (NYSE: MON ), and FedEx (NYSE: FDX ). That’s an impressive list of companies, including a couple of Dow components. (See all holdings here ) The total value of the ETF is a little over $2.7 billion, meaning Apple represents about $145 million. That doesn’t sound like much when thinking about Carl Icahn’s couple of billion worth of Apple’s shares or the market cap of nearly $700 billion. However, to the average investor, it is still a lot of money. Another ETF buying up a chunk of Apple makes less shares available to the public, which Apple’s buyback is also helping with. Adding Apple and IBM to the ETF should help PKW become more popular. On the face of it, a buyback ETF seems like a great idea. When stocks are rising, those that are buying back shares should do even better. When stocks are falling, buybacks should ease the fall. Companies are spending a ton of money on buybacks currently . In the chart below, you can see how PKW has significantly outperformed SPY over the past five years. (click to enlarge) (Source: Yahoo! Finance) The ETF market just got a bit more interesting, as Apple and IBM have been added to the PowerShares Buyback Achievers Portfolio ETF. These names may only stay in the ETF for a year, but they certainly will attract attention to PKW. This has been one of my favorite ETFs over the past couple of years, and its performance has been rather spectacular. For those looking for some exposure to Apple or IBM without gambling on them individually or the tech sector as a whole, perhaps you should take a look at this name. Disclosure: The author has no positions in any stocks mentioned, and no plans to initiate any positions within the next 72 hours. (More…) The author wrote this article themselves, and it expresses their own opinions. The author is not receiving compensation for it (other than from Seeking Alpha). The author has no business relationship with any company whose stock is mentioned in this article. Additional disclosure: Investors are always reminded that before making any investment, you should do your own proper due diligence on any name directly or indirectly mentioned in this article. Investors should also consider seeking advice from a broker or financial adviser before making any investment decisions. Any material in this article should be considered general information, and not relied on as a formal investment recommendation.