Tag Archives: seeking-alpha

Dominion Resources Provides Secure Future To Growth-Seeking Investors

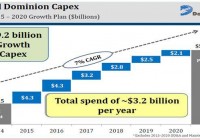
Summary Company’s accelerated investments in growth-generating projects are expected to drive earnings trajectory and revenue base in upcoming years. Sturdy investments will improve company’s free cash flow productivity. Free cash flow productivity will help increase dividends in coming years. Dominion Resources (NYSE: D ) has carved out its plan to excel in the long term through its heavy investments in several growth projects, directed at improving its infrastructure and expanding power generation capacity. As the company is actively pursuing growth projects, the future outlook of D’s revenues growth looks impressive. Also, healthy growth prospects of these projects will significantly improve the company’s free cash flow productivity, which will in turn enable D’s shareholders to enjoy secure and sustainable dividends. The company will continue to enjoy strong earnings growth due to its hefty investments in these long-term growth-generating projects. In addition, the stock currently offers a healthy dividend yield of 3.55%, which makes it attractive for dividend-seeking investors. Powerful Investments = Secure Long Term The U.S. utility sector has exited 2014 with healthy results, as utility companies are investing heavily towards infrastructure improvement and the expansion of its generation capacity. I believe the sector will deliver a much-improved performance throughout 2015 as well. As far as D is concerned, the company has laid out its $19.2 billion capital expenditure (CAPEX) plan, which involves spending approximately $3.2billion/year over the next six years in several long-term growth-generating projects, shown in the graph below. Source: Analyst Day Meeting Slide Presentation Under the $19.2 billion growth CAPEX plan, D has significant growth projects, such as solar, offshore wind, liquefied gas export and construction of more pipelines. As far as the company’s solar projects are concerned, D has laid out its plan to construct several solar projects in Virginia for $700 million . The facilities where D is planning to invest $700 million will enable it to power 100,000 homes and are expected to be operational by 2020. Moreover, these facilities will produce approximately 400MW of solar energy, bringing D’s total solar energy generation capacity to 744MW. Owing to the recent increase in regulatory restriction by the government to lower carbon emissions while producing electricity, I believe the company’s increased focus on generating solar energy is commendable. Moreover, Virginia solar assets are regulated, which means increased solar investments in Virginia will bring healthy rate base growth for D, helping its revenues improve and cash flows to grow at a decent pace. Moreover, the company has received regulatory approval to begin construction on its promising gas generating project “The Cove Point Liquefaction Project”. The project is expected to be operational in late 2017, and by far, its facilities in Maryland are complete, 74% from engineering and 77% from procurement prospects. Owing to the fact that the Cove Point Liquefaction Project will enable D to export LNG outside Louisiana and Texas, I believe the completion of this project will boost the company’s financial performance. D has already entered into a 20-year LNG delivery agreement with Gail India and Japan’s Sumitomo Corporation, which will mean significant upside for the company’s top-line and bottom-line numbers. Along with Cove Point, there’s a lot of work going on building a natural gas infrastructure. In a 550-miles natural gas project, Atlantic Cost Pipeline (ACP), where the company owns a 45% stake, almost 55% of procurement has been completed. And by the time the ACP project will be operational by late-2018, D will be able to purchase significant capacity of pipeline to transport natural gas through 20-year take or pay contracts. The significance of the ACP project lies in improving the company’s natural gas transmission capacity, which means more upside for its future earnings and revenue base. Owing to the healthy growth prospects of D’s robust investments, the company believes that over the next six years, these long-term growth-generating projects will drive 6%-7% of its earnings growth/year. Also, analysts have anticipated that over the next five years, D’s earnings will grow at an average annual rate of 5.79% Secure and Sustainable Dividends D has a long history of making healthy cash returns to its income-seeking investors through hefty dividend payments. As a matter of fact, the company’s healthy earnings growth prospects have been helping it generate strong cash flows, which have been backing its dividend payment policy. D currently offers an attractive dividend yield of 3.55% . As the company’s healthy growth projects have accelerated its cash flows, D recently announced a quarterly dividend payment of 64.75 cents , which results in a yearly dividend rate of $2.59/share. And this new dividend rate corresponds with an increase of 8% from the 2014 dividend rate. Along with approving the dividend increase for 2015, the company’s board has given their consent to maintain the dividend increase at the 2015 growth level for upcoming years, enabling it to achieve a compound annual dividend growth rate of 22% in the next five years. The longevity of D’s healthy growth projects highlight that the healthy dividend payments will make the management’s anticipated payout ratio of 70%-75% achievable in 2015. The following table shows the company’s healthy dividend per share and dividend payout ratios for the last three years and for the years ahead, based on my estimates. 2012 2013 2014 2015(NYSE: E ) 2016( E ) Dividend Per Share $2.11 $2.25 $2.40 $2.59 $2.80 Dividend Payout Ratio 69% 69% 70% 71% 76% Source: Company’s Yearly Earnings Reports & Equity Watch Estimates Risks The company’s future growth prospects are exposed to increased risk of regulatory restrictions, power and gas price deterioration and adverse commodity prices fluctuations. Moreover, unfavorable economic changes and the management’s mishandling could undermine the potential of D’s heavy investments in several growth projects, affecting its future stock price performance. Conclusion I am bullish on D. The company’s accelerated investments in growth-generating projects are expected to drive its earnings trajectory and revenue base in upcoming years. Moreover, these sturdy investments will improve the company’s free cash flow productivity, helping it to increase dividends in the coming years. I recommend long-term growth-seeking investors buy D, as the company offers secure long-term growth. Disclosure: The author has no positions in any stocks mentioned, and no plans to initiate any positions within the next 72 hours. (More…) The author wrote this article themselves, and it expresses their own opinions. The author is not receiving compensation for it (other than from Seeking Alpha). The author has no business relationship with any company whose stock is mentioned in this article.

Will Yellen Move The Price Of SLV?

Summary The price of SLV fell down in the past week. Will Yellen’s testimony move the price of SLV? The rally in the U.S. treasury yields coincided with the drop in silver prices. The silver market cooled down in the past week as shares of the iShares Silver Trust ETF (NYSEARCA: SLV ) fell by 6%. For SLV, the upcoming testimony of Yellen and the latest developments in Europe could curb further down SLV. Yellen testifies Following the release of the minutes of the FOMC meeting, the upcoming testimony of FOMC Chair Yellen will take the center stage this week. Yellen will testify on Tuesday and Wednesday before the Senate Banking Committee and House Financial Services Committee, respectively. The latest minutes were perceived a bit dovish. After all, the probabilities of a rate hike have gone down a bit for both July and June compared to previous weeks. Because of the dovish tone in the minutes, some market analysts think that Yellen’s testimony will be a bit more hawkish – given the strong numbers presented in the latest non-farm payroll report, this scenario is plausible. But Yellen isn’t likely to rock the boat and reiterate that a decision on a rate hike will be data dependent. Since the FOMC is slowly adjusting the markets for a rate hike in the coming months, it’s unlikely that there will be a surprise or significant delay. This is true because central banks tend to “surprise the markets” and change the market expectations when it comes to stimulating the economy. When it comes to austerity and rate hikes, central banks tend to be much more cautious, prudent and give enough time for the market to adjust to the new policy. The biggest fear of a central bank is that its policy change will lead to an economic slowdown or even recession. Besides Yellen’s testimony, the second estimate of the U.S. GDP for the fourth quarter will be released on Friday. In the first estimate, the GDP growth rate was 2.6%, which was a bit lower than market expectations. If the GDP growth rate comes lower than current estimates, which are 2.1%, this news may bring back up the price of SLV. Another report worth considering is the U.S. CPI, which will be released this week. A drop in the core CPI could actually bring up SLV – this could revise down the FOMC’s inflation expectations. In the meantime, the recent developments in Europe may have also contributed to the weakness of SLV. Greece’s debt problem was defused, for now… One factor that could have had some indirect implications on the levels of risk in the financial markets, which may have benefited precious metals investments such as SLV, is the Greek debt problem and the possibility of a Greek exit from the European Union. The recent news from this front is that the Greeks have practically conceded to the Germans : The Greeks didn’t achieve too major goals to the austerity measures set in place. Greece received a four-month extension on its bailout. In exchange, on Monday, the Syriza-led government submitted its list of structural reforms that will need to be approved by the EU members. At least when it comes to the fiscal targets, the Greeks got a victory, and the budget surplus of 4.5% of GDP is on the table and the target could come down to 1.5% next year. These developments are likely to push away the whole Greek exit talk for the near term from the markets’ agenda. One of the main events of the week in Europe is the third tranche of the targeted LTRO. The last two auctions came short of market expectations. If this tranche also fails to reach high levels, then it could suggest the ECB may wish to expand its QE program. For SLV, lower risk in the financial markets could bring further down its price. One way is via the changes in the U.S. treasury yields. The sharp fall in U.S. long-term treasury yields at the beginning of the year changed course in recent weeks, as indicated in the chart below. Source: U.S. Department of Treasury and Bloomberg The linear correlation between SLV and U.S. long-term treasury yields isn’t strong at only -0.17 (for 7-year yields), but precious metals, especially gold, tend to have a strong relation with treasury yields. Nonetheless, the rise in U.S. interest rates, as the market expects a rise in the Fed’s cash rate in the middle of the year, could further contribute to the weakness of SLV. In the past week, the amount of silver ounces in SLV has picked up a bit albeit the silver ounces in this ETF are still down for the year. Source: iShares Silver Trust website It’s still unclear when, if at all, the FOMC starts to raise rates. For now, it seems that unless we will see a major change in the U.S. economic recovery, the FOMC will likely to raise rates in the middle of the year. Yellen’s upcoming testimony could provide some more insight about the next policy change, but I suspect this testimony, much like others in the past, won’t offer more than a general tone and “data dependency” policy. The recent diffusion of the Greek debt crisis is likely to curb down the demand for investments that are considered safe haven such as precious metals. For now, the possible upside for SLV is if the U.S. economy’s progress fails to meet market expectations (e.g. lower-than-anticipated growth in GDP or CPI). In such an event, SLV could rally, even if for a short term. For more see: Will Higher Physical Demand For Silver Drive Up SLV? Disclosure: The author has no positions in any stocks mentioned, and no plans to initiate any positions within the next 72 hours. (More…) The author wrote this article themselves, and it expresses their own opinions. The author is not receiving compensation for it (other than from Seeking Alpha). The author has no business relationship with any company whose stock is mentioned in this article.

The VIX: What It Is, What It Isn’t, What To Do About It Now

Summary Widely regarded as the “fear factor” forecaster of stock market price declines, it has an irregular, unreliable pattern of prophecy. Perversely, it is a much more reliable forecaster of general market index recovery. What should we believe it is telling now? How best to profit from its ODDS and PAYOFFS of prior outcomes? Where the VIX comes from The basic equation of stock option valuation contains several interrelated factors, including the underlying stock’s price, which when solved provides an appropriate price for each of the several available strike-price and expiration-dated option contracts. One of the key input factors common to all the contract price solutions is the issue of uncertainty present for the underlying stock’s future price. From the start of trading in listed stock options over 40 years ago, options traders turned the contract pricing formula around and accepted the market’s options trading prices as inputs, in place of the uncertainty component of the equation, and solved for the stock’s “implied volatility.” Traders discovered that the degree of “implied vol” for each stock tended to have a usual level of uncertainty across time, and being aware of current variances from its norm, provided them with profitable trading insights into future prices. By applying this approach to options on a market index, the Chicago Board Options Exchange [CBOE] in 1983 devised and copyrighted the term VIX to designate an index measure of the S&P 500’s implied volatility. The VIX Index is quoted in percentage points and represents roughly the (thus derived) expectations of potential change of the S&P 500 in the next 30 days. Direction of change is not indicated. If it’s a Fear Index, why does that matter? That should be obvious, but let’s test it out. We go to a reliable, available source for data, like Yahoo Finance, and obtain all the available daily data history for the VIX Index (since 1/2/1990) and for something appropriate that we can easily trade, like the SPDR S&P 500 Fund ETF (NYSEARCA: SPY ). It is available from 1/29/1993, downloaded in .csv (comma separated values) for easy use in a spreadsheet tool like Excel. There are well over 5,000 days of data to use, over ten years worth, plenty to offer statistically reliable inferences. Matching up the dates from the two data sets, we calculate what has been the worst possible price change for SPY in the coming 3 months after each day, and compare that with the VIX Index value at the initial date. Figure 1 shows what we get. Figure 1 (click to enlarge) The VIX Index in these 11 years never got much below 10, and days measuring above 30 start to get sparse. Much of the time between its 10 to 15 value looks to be completely random. There the worst next-3-month market declines are concentrated around -5% to -7%. Days with VIX above 15 start to see a shower of more substantial declines, plus a lot of the less than -5% kind. The best-fit line confirms the general relationship of higher index numbers with larger market declines. But the far fewer large outliers seem to dictate the fit relationship, compared to scads of close-in, small-scale comparisons. Just to be fair, let’s look at the other side of the coin: What were the market’s best days in the next 3 months, compared to the “fear-factor” advance warning? Check out Figure 2. Figure 2 (click to enlarge) This looks strangely like a mirror of Figure 1’s market moves to the downside, hinged along the zero% change line. Now the relationship line shows increasing market price gains as the VIX Index is higher. Where the index is small, the level of determination is small to any degree of specificity. Figure 2’s contrast with Figure 1 demands some more inclusive measure of the usefulness of the VIX as a forecaster of coming market behavior. In Figure 3, we attempt this by relating the index levels to a fixed holding period price change in SPY. Our first effort, using 3 months as a test period does not provide any motivation to believe that a longer or shorter holding would create much difference. Figure 3 (click to enlarge) VIX Index values over a long period of observations have proven by themselves to be a truly rotten forecaster of likely subsequent market price changes, either to the downside, the upside, or simply on average. Figure 3 has a relationship line basically independent, one of the other. One encouraging thing about this is that the presence of the VIX Index may have helped keep the market balanced, as evidenced by there being no sign of a pattern of advantage created by the presence of this sophisticated analytical measure. Its early benefits, if any, were quickly arbitraged away by astute observers. Inherent in the nature of the VIX Index’s creation is that it tries to define uncertainty, rather than differences of value from some norm or standard. The statistics involved can identify levels of uncertainty, but lack any useful directional sense in their derivation. When the game changed In early 2006, options on the VIX Index (VIX) itself were listed by the CBOE and began trading on a daily basis. That permitted us to show what the market’s own actions have as a forecast of this presumed market forecaster. But now dimensions of price change direction now are being shown, when the means of making such forecasts are known, as we do using behavioral analysis principles. What are today’s directional indications for the VIX? Figure 4 presents this past Friday’s closing-prices-based forecast for the VIX Index in its most right-hand vertical bar. It represents a range of that index’s potential market quotes in coming days, weeks, and few months. Figure 4 (used with permission) Readers of our Intelligent Behavior Analysis articles on Seeking Alpha are familiar with the measure we use to identify likely directional emphasis resulting from the analysis. We term our measure the Range Index [RI], calculated from the price range being forecast by the analysis of the investment subject. It indicates what proportion of the whole range lay downward from the current price. In Figure 4, the RI of the VIX is 7. That means 93% of the forecast range is to the upside, a typically strong condition. With a current market quote of $14.30 for the VIX and an upside limit to the range of $18.82, a rise in price by +31.6% is viewed as likely enough to be possible that parties becoming at risk to changes in its price are willing to pay for protection against the change, should it happen. The possibility of a complementary price decline works out to a -2.5% change. At these extremes, there is about a 13-to-1 prospect of advantage on the “reward” side over the “risk” exposure (of a bet on the VIX). We have devised a simple, but powerful, investment portfolio management discipline that functions very effectively using this kind of information. We use it as a standard of behavior to compare the investment desirability of virtually all of the roughly 3,500 equity securities examined daily. Applied to the VIX, its results appear in the row of data between the two blue-background pictures of Figure 4. The results are that in the 124 prior instances of the 1,261 market days in the last 5 years where a 7 RI of the VIX occurred, 76% of them were profitable experiences. The net gains in all 124 earned +24% gains in average holding periods of 36 market days, which would have produced an average annual rate of return of +355%. If the VIX were a security that could be bought and sold, most likely this would be a good point in time and price to buy it. But the VIX is an index that cannot be bought or sold as a security. There are, however, ETFs that are based on movements of the VIX Index that can be traded conventionally. Ready to get confused? This is where two logical inversions take hold of the task of making money from what can be known about the VIX, its dependent ETFs, and the market as evidenced by the S&P 500 Index, or SPY. The first inversion comes from investors’ normal association with being “long” in assets that rise sympathetically when the “market” goes up. The “price” of the VIX is a measure that rises when the market unexpectedly goes down, reflecting increasing investor uncertainty. And uncertainty is what the VIX measures. So, when market prices go down, VIX Index goes up. The second inversion comes from investors’ usual attempts to find forecasting tools that will anticipate market moves, allowing them to position themselves to be drawn along by or accentuated by the market’s investing gravity. As we showed in our prior article about the VIX, the sequence is reversed here. It is the market’s actions that forecast subsequent VIX-related price moves, not the other way around. Then there is simply a complexity in that the ETFs related to the VIX are most directly denominated not by the VIX Index itself, but by the prices of futures contracts on the index. While there are logical parallels, each security has its own markets, with frequent individual local influences that may obfuscate otherwise reasonable expectations. Arbitrage here is not a game for the casual practitioner or the dilettante. The array of ETPs at hand includes: iPath S&P 500 VIX Short-Term Futures ETN (NYSEARCA: VXX ) ProShares VIX Short-Term Futures ETF (NYSEARCA: VIXY ) ProShares VIX Mid-Term Futures ETF (NYSEARCA: VIXM ) VelocityShares VIX Short-Term ETN (NASDAQ: VIIX ) ProShares Ultra VIX Short-Term Futures ETF (NYSEARCA: UVXY ) ProShares Short VIX Short-Term Futures ETF (NYSEARCA: SVXY ) Their MM forecasts and forecast history details are in Figure 5. Figure 5 (click to enlarge) Remember please that the orientation of this data is from having or taking a long position in the designated security. All except SVXY are expected to go up in price when the S&P 500 goes down meaningfully. SVXY, being a security that is short its VIX futures holdings, should rise when the VIX futures go down. Further, all of the historical data (in columns 6 and 8-15) is from the standard portfolio management discipline applied to prior appearances of forecasts with upside to downside balances like today’s, as indicated in column (7). Tomorrow or a week from now, these balances are likely to be different, and if so, decisions at that time need fresh historical backgrounds. But at this point, the attractiveness of a long-position bet in each is ranked by the figure of merit in column (15). It attempts to blend odds of profitability with win-loss ratios and frequency of prior opportunities specific to each issue under conditions like the present. Conclusion On this basis, the VIX Index itself is the best bet, but one not directly placeable. Certainly, the efforts of Greeks and the EU keep the VIX uncertainty pot boiling. The implication is that the S&P 500 Index is likely to encounter a decline in the next 3 months, significant enough to pop the VIX from 14+ to near 19. But the cost of making that bet through VIX futures is already priced high enough that the odds of making money at it are less than a coin-flip and as little as one in 8 or one in 12. The sole exception to such a dismal proposition is that over the course of the coming 3 months, the S&P is seen likely to rise sufficiently to generate a profit in SVXY from here in nearly 8 out of 10 tries. In the past, such propositions (43 market days out of the nearly 3 years of that ETF’s existence) have generated net gains of over 8% in less than 6 weeks of average position holding times for a +98% annual rate of gain. Now, that’s pretty attractive. But there is a possibly better strategy than just buying SVXY here. If the market pros who daily express their views about the near future of the S&P 500 via hedging in the index futures markets are right and the VIX odds say they are right 3 out of 4 times (76 out of 100), the SPX and the SPY are likely at that new lower point of the S&P 500 to be supporting an even better (lower) buying price on SVXY than it now has. Many variations of action implementation can be imagined. Disclosure: The author has no positions in any stocks mentioned, and no plans to initiate any positions within the next 72 hours. (More…) The author wrote this article themselves, and it expresses their own opinions. The author is not receiving compensation for it (other than from Seeking Alpha). The author has no business relationship with any company whose stock is mentioned in this article.