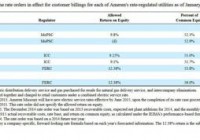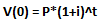
Competitive pressures are present in almost every industry. These pressures lower returns on capital and could lower future investment returns. Finding companies with sustainable competitive advantages can aid investors in generating higher investment returns. Competitive advantages can be broken down into various buckets to assess which attributes directly affect industry competition. Overview & Introduction: In the following write-up, I hope to outline a succinct process on analyzing the competitive dynamics of an industry and/or firm and why those dynamics matter for investing. Competitive dynamics play an utmost role for those investments that are long-term and “buy and hold” in nature so analyzing those dynamics correctly is paramount to achieving attractive returns. Concepts: Before one can discuss the role of competitive dynamics, why these dynamics matter to investments needs to be established. First, investment returns over longer periods of time are more affected by per period returns due to compounding. Using the following formula, one can see how higher return investments only start showing large differences further out in time. (click to enlarge) The first graph shows the difference in ending notional value of $100 compounded over 20 time periods at rates of 5%, 10%, 15% and 20%. The second graph shows the notional difference between the ending values of 20% compounded vs. the same amount compounding at 5%. It can be easily seen that the difference is rising exponentially over time. While this fact is very well known within the investment community, I am pointing it out for a reason different than most other discussions. Just like in investment returns for a portfolio of financial assets such as stocks or bonds, corporations benefit from compounding in the same way. As such, investors should prefer those companies that are able to invest in high return projects. Firms that generate returns on projects far above their cost of obtaining the capital to invest in those projects are said to generate economic profit(s). In all but a few circumstances, a company that is able to invest in high return projects over a long period of time will generate more economic profit than a company that is investing in low return projects. This idea, however, clashes with a basic tenet of firm theory in classical economics: excess economic profits are competed away in the long-run. Competition: Investors prefer to own firms that can invest in projects with high returns on capital. To illustrate this with an example, imagine owning a lemonade stand that costs $500 to start-up and generates $100 in after-tax profits. Now compare that to a newspaper route that costs $1000 to start-up but generates $150 in after-tax profits. In the second example, you generate 50% more profit but require double the investment to do it. A rational investor would prefer to invest in the lemonade stand (or two) rather than invest in the newspaper route. The issue for investors is that capitalism and the free market pushes down returns on capital. Investments with high returns draw new capital to them in hopes of generating those returns and competitive market forces will try to ‘compete’ away those returns. Classical economics sums it up as firms will generate economic profit in the short-run but in a perfectly competitive market, those firms will generate zero economic profit in the long-run. The Importance of Returns on Invested Capital: An investor is left with a difficult task: find firms that generate high returns on capital but are able to do so despite the free market constantly trying to compete away those high returns. While many industries and firms exhibit the more perfect competition estimated by economic textbooks, the real world is not as cut and dry. Persistence of Returns on Invested Capital In fact, there is relatively decent empirical evidence that there is a persistence of industries and firms to generate economic profits which are not inevitably competed away. In a study done by Credit Suisse, they examined changes in returns on invested capital over five year periods from 1985 to 2013. Each business was placed in quartiles with Q4 being the highest return on capital businesses and Q1 being the lowest. The values are calculated at the end of each five year period. The table of those results is presented below. This table is empirically showing that there is a persistence of high returns and that those returns are not the result of chance. The two most important boxes to examine are column 4, row 4 (Q4, Q4) and column 1, row 1 (Q1, Q1). If returns on capital were merely the result of chance, the probability of any company shifting from one quartile to another would be 25%. This table shows that this is not true, as the probability for a top quartile business to stay there five years later is 51% and the chance for that top quartile company to stay in the top half is almost 80%. By the same token, 56% of those businesses that were in the bottom quartile remained in the bottom quartile five years later. Simply put, good businesses tend to remain good businesses and poor businesses tend to remain poor businesses. Drivers of Returns on Capital Before one can get into the sustainability of high returns on capital driven by competitive advantages, it would be useful to examine the underpinnings of returns on capital. Breaking down the measurement of return on capital to its singular components will make it easier to understand and conceptualize the different competitive advantages and how they link back to a company’s ability to generate high returns on capital. Return on Invested Capital is calculated as Net Operating Profit after tax (NOPAT) divided by the firm’s equity and debt. For this example, I am ignoring any short-term funding attributed to suppliers or employees and all funding of a firm’s assets is provided by debt and equity. The ROIC calculation can be broken down into its separate parts, similar to the DuPont method for estimating return on equity. Note that cross multiplication of the terms on the right side will result in the left. A further adjustment can be made in this example since the only funding of the firm is from equity and debt. Given that assets must equal debt plus equity, in this example the last term is equal to one. This reduces the return on invested capital allocation [A] into two parts: the margin on sales [B] and asset turnover [C]. When discussing possible attributes and characteristics that drive sustainable returns on capital, those attributes must cause an industry or firm to be able to sell their services at a very high margin or to use their assets extremely efficiently. Porter’s Five Forces The topic of competitive analysis is not a new one and has been studied by many individuals, the most well-known being Michael Porter of Harvard University. He surmised his thoughts on competitive strategy into his Porter’s Five Forces. The rest of this write-up will modify some of the forces he discusses and relates them specifically to those which I believe affect a company’s ability to generate sustainable returns on invested capital. Competitive Analysis: To summarize, investors want to own high return businesses that can generate those returns sustainably, which is a problem since free market competition tries to drive those returns down. Given empirical evidence that some companies have seen sustainable returns on invested capital over long periods of time, developing a list of attributes that contribute to sustainable returns on capital would improve investment selection and future returns. The list below summarizes six of the most important attributes that, in my opinion, affect a company’s competitive advantage. This list is not exhaustive but instead reflects the most important attributes that I believe contribute to strong competitive advantages. The order of this list is in no relation to how strong I believe each attribute is to generating a specific competitive advantage. Low cost provider/producer Patents and governmental privileges Governmental and other agency regulation Brands Network effects High switching costs Low cost provider/producer The first attribute that contributes to a competitive advantage would be that of the low cost producer/provider. This is the only attribute on the list that explicitly focuses on the asset turnover [C] aspect of the ROIC calculation, large due to the fact that low cost producers tend to minimize margins and maximize asset productivity. The most obvious example of this would be Wal-Mart (NYSE: WMT ). Wal-Mart generates 5% operating margins but almost 20% returns on invested capital due to high asset turnover. Wal-Mart can do this through its massive scale and productivity, driving down their cost of procuring goods. The core competitive advantage of Wal-Mart is to be the low cost retailer. I view this attribute as the most transitory one as technological change can quickly bring about a new low cost producer. A company that pitches itself as THE low cost producer needs to make that message known to its customer and the firm must be continually investing to lower their costs and maintain that competitive advantage. Patents and governmental privileges This is a very obvious strong competitive advantage as a patent on a product creates a legal barrier to prevent substitutes from taking market share. However, a single patent does not offer significant competitive advantages as that patent will eventually expire. Instead, a company with multiple patents, for example a drug portfolio with many patents staggered over time with more in the pipeline, is a better example of a company that uses patents to create a competitive advantage. Another form of competitive advantage is the trademark, which will closely relate to the discussion on brands. Unlike patents, trademarks can potentially be infinite in length and confer a legal right to the owner to be the sole user of that brand. As an example, the logo for Pepsi soda is very valuable to PepsiCo (NYSE: PEP ) because the company has spent billions in advertisement dollars to build up brand preferences in consumers. If PepsiCo did not have a trademark on the logo and its blue can, businesses could essentially generate look-alike cans that share the likeness of the Pepsi logo and make money selling that soft drink to consumers that thought it was a Pepsi product. This concept explains why counterfeit goods exist. The government, by conferring these rights of a trademark to a company, are essentially giving incumbent branded goods companies a potential barrier to entry that prevents potential competition. Governmental and other Agency Regulation While some forms of governmental regulation minimize a company’s ability to generate sustainable returns (SIFI designations for large cap banks and price regulations on utilities come to mind), more often than not rules and regulations created by the government limit competition and help build competitive moats for some businesses. A good example of this is the beer distribution system in the US. Following the end of Prohibition, not all of the regulations were removed. One of the regulations regarding distribution of beer in the US remained and this three-tiered distribution model helped large brewers take significant market share and economic profits over last few decades. In the US, beer cannot be sold from a brewery directly to a retailer or a restaurant/bar. All beer in the US must be first sold to a wholesaler and then the retailer or bar. Many of these distributors were then controlled by the big brewers such as Molson, Anheuser-Busch and Coors. These factors greatly reduced competition in the sale of beer in the US giving incumbents are competitive advantage. Another example of local regulation that prevents competition would be the requirement for certain spirits to be distilled and aged in certain geographic locations to be branded as specific types of spirits. In the UK, Scotch whiskey can only be labeled and sold as such if it is produced following specific regulations, one of which is that it must be distilled and aged in Scotland. Similarly, brandy can only be called cognac if the production follows stringent legal requirements. These legislative hurdles prevent new competition from entering specific industries. Brands Brands are one of the best known competitive advantages a company can acquire but are also one of the most overused terms when discussing a company’s competitive advantages. In my opinion, to be a true brand, it must either create high switching costs for the customer and/or fundamentally change the spending behavior of the customer. Just because a company pitches its brand as one does not mean the brand provides value to the business that owns it. The Coke (NYSE: KO ) brand is a simple example for the high switching costs brands can create. A consumer who enjoys the attributes of a Coke (taste, level of carbonation, level of caffeine, etc.) has a cost to searching out and switching to a new soft drink or other beverage. The risk of drinking a beverage one may not enjoy is enough for most people to pay the premium Coke charges for its soft drinks. The value of a brand is signified in the financial statements by gross margins. I view it as the opposite of Wal-Mart in terms of which factor, [B] or [C], drives ROIC for the business. Great brands allow a business to sell a good that has very inexpensive inputs at a very high price, in large part due to the logo placed upon the product. Many investors may argue that Ford (NYSE: F ), GM (NYSE: GM ) and Toyota (NYSE: TM ) have strong brands but with gross margins between 8-13%, I would argue that Auto OEMs do not have strong brand names. Compare those gross margins to a company like Louis Vuitton (LVMH), which generate a gross margin of 64.7% in FY2014. Clearly, consumers of LVMH goods are willing to pay up for the brands they sell given such a high gross margin. Network Effects Network effects are externalities that are created as more people use a product. This can also create high switching costs for users of some products as the network becomes more valuable and useful the more users that use it. Some examples of companies with network effects are the credit card networks Visa (NYSE: V ) and MasterCard (NYSE: MA ). As more users carry Visa or MasterCard branded cards, more merchants will accept them and more banks will clear through those networks. This creates a significant barrier to entry given new entrants will have an increasingly difficult time shifting consumers over to a new card. New cards may be cheaper to use but have little value since very few merchants would accept them and very few banks would clear transactions over those networks. Similar to other competitive aspects on this list, strong network effects typically confer high margins to those companies that exhibit that attribute. As such, operating margins at both Visa and MasterCard are over 60%, suggesting extremely strong network effects. High-switching Costs The last attribute that can give a company a distinct competitive advantage would be an aspect of the business that creates high switching costs. High switching costs prevent a customer from moving away from a good or service once they have begun using it or have installed it. Additionally, high switching costs could be created by a good that contributes a significant amount of the important attributes of a finished good but is just a fraction of the cost of the end good. An example of the first type of switching costs would be the financial services payment processors such as Fidelity National Services (NYSE: FNF ), Fiserv (NYSE: FIS ), and Jack Henry & Associates (NASDAQ: JKHY ). These companies sell the back-end technical support for banks to provide payment processing and other technology solutions such as mobile banking. Given each bank’s workflow is based around the services and technology provided by these firms, the cost to switch to a different provider can be significantly high. These costs prevent the banks from switching away from these companies, providing them with significant competitive advantages and high returns on capital. The second type of high switching costs has to do with products that have high value to the end users but make up a small percentage of the end good’s total input cost. A good example of this business would be the flavors companies such as International Flavors & Fragrances (NYSE: IFF ) and Givaudan. These companies produce the ingredients that companies like Kraft (NASDAQ: KRFT ) and General Mills (NYSE: GIS ) use in their end products. Yoplait yogurt has a distinct taste and texture that consumers have known and prefer if they are a consumer of the brand. However, the input costs of some of the important ingredients that develop that Yoplait taste and texture are often just a small percentage of the total cost of General Mills producing that good. Because of the potential for consumer backlash should General Mills switch ingredients (recall the New Coke issue in the 1980s) and risk lowering sales and profits, General Mills has little incentive to switching suppliers given the relatively high switching costs. This confers a competitive advantage to specialty ingredient suppliers like IFF. Conclusion: To summarize, investors want to own high return businesses that can generate those returns sustainably which is a problem since free market competition tries to drive those returns down. By examining a business’s competitive advantages, investors can screen for investments that generate attractive returns over very long periods of time. Editor’s Note: This article discusses one or more securities that do not trade on a major U.S. exchange. Please be aware of the risks associated with these stocks. Disclosure: I am/we are long V. (More…) I wrote this article myself, and it expresses my own opinions. I am not receiving compensation for it (other than from Seeking Alpha). I have no business relationship with any company whose stock is mentioned in this article.