Why We Think QQQ Is A ‘Sell’
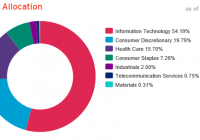
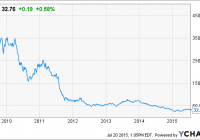
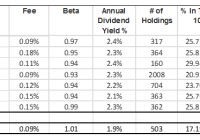
Summary PowerShares QQQ is over-extended and primed for a reversal. Major components face numerous headwinds. We think QQQ should be avoided, sold or hedged. Quick Background The PowerShares QQQ Trust ETF (NASDAQ: QQQ ) is an exchange traded fund based on the Nasdaq-100 Index consisting of large and domestic and international non-financial companies listed on NASDAQ based on market capitalization. The fund’s current breakdown by sector is information technology (54.2%), consumer discretionary (19.8%), health care (15.7%), consumer staples (7.3%), industrials (2%) telecom (0.75%) and materials (0.31) as of July 16, 2015. And here are the current Top Ten holdings: The top holding in the fund is Apple (NASDAQ: AAPL ) which makes up about one-seventh of this ETF. Next are the combined classes of Google (NASDAQ: GOOGL ) at about 8%, Microsoft (NASDAQ: MSFT ) at 7%, followed by Amazon (NASDAQ: AMZN ) and Facebook (NASDAQ: FB ) both about 4%. These five companies make up about 36% of the QQQ. As you can see, the fund is quite top-heavy with ‘safe’ bellwether, cash-rich companies. This perceived safety is exactly what makes us nervous. Here are a few challenges and observations that may offer a different perspective. The 750-Ton Gorilla Apple, a phenomenal company and once-in-a-lifetime stock, is up almost 15,000% over the last 12 years. With a market cap of almost three-quarters of a trillion dollars, it would seem quite amazing (and unlikely) to us if it reached the trillion dollar milestone. It seems that all the good news (tons of cash, fantastic earnings, unrivaled brand recognition) and very little of the bad news (supplier issues, China fallout, future commoditization of its hardware products, competition from Samsung (OTC: SSNLF )) is priced in. The biggest weakness for Apple probably is its size, given what it would take to move the needle much further. Recently, AAPL’s stock has looked pretty weak on a relative basis and is not matching the Nasdaq Composite to new highs. Since the stock is already the top weighting in so many indices, ETFs and mutual funds you have to wonder if everyone that’s wanted to buy the stock already has. We admire Apple the company but think the risk reward profile has tilted negative for the stock at this stage and would look to buy the stock at significantly lower levels. Taking some money off the table after a huge run (the stock back over $132) is never a bad idea. Investors will be hesitant since they presumably have plenty of capital gains (and might not want to incur the tax liability) or simply think the stock is going higher and don’t want to miss out on the upside or dividends. We can understand that. If that’s the case, this represents an inexpensive opportunity to hedge with options, especially with overall volatility low (the VIX around 12). Apple is such a liquid stock that the options are likewise accommodating with minis, weekly’s and various contracts out to 2017. Regulation The QQQ giants may have targets painted on their backs. The New York Times ran an article last week about European regulators going after the ‘U.S. Tech Giants’ and mention all the big names, Google, Apple, Amazon, Microsoft and chipmaker Qualcomm (NASDAQ: QCOM ): (click to enlarge) The regulatory drums are really pounding against Google from the European Union regarding unfair traffic diversion from competitors to its own services. The EU could very easily look into Googles other search products like travel and online mapping. The EU is short on money and these giant American companies have the cash, as cynical as that sounds. Anti-big business rhetoric could also ramp up here in the U.S. and the companies flush with the most cash could be targets. And once the litigation begins, it will persist. Just ask JPMorgan (NYSE: JPM ). This should remain a headwind for the tech giants in the QQQ. Dwindling Powder What is fueling this market rally? Leverage. Total margin debt is now at all-time highs recently reaching $507 billion (82% higher than at the top in 2000). A similar bullish extreme is seen among mutual fund managers, according to Elliott Wave International. In their article, they note, “The percentage of cash in mutual funds has been below 4% [near fully invested] for all but one of the past 70 months (a period of nearly six years). Prior to this time, the longest such duration was only nine months, a streak that ended in October 2007.” The chart they provide indicates that this data goes back to at least 1960. These two contrary indicators are remarkable and speak to the level of persistent, excessive bullishness evident in today’s market environment. Essentially everybody that wanted to be “in” this market is already in. Granted, this isn’t related to just tech but the market as a whole but if the market turns, the main stocks in QQQ will be hit right along with them, flushed with cash and all. Just as buying mutual funds and ETFs helped fuel the component stocks rise, the selling of these highly liquid names in a crunch will likewise sell them off even faster. Let’s not forget that from 2000-2002, QQQs lost over 83% of its value, full of blue-chip companies like Microsoft, Cisco (NASDAQ: CSCO ) and Intel (NASDAQ: INTC ). Those same names are still among the QQQs largest weightings, #2, #8 and #9 in the QQQ, respectively. Today’s new members, including Apple, Google, Amazon and Facebook, should face similar greetings. ‘Melt Up’ The pace of buying for today’s members of QQQ is very worrisome. Last week’s buying frenzy was remarkable-Google up 25%, Amazon up 9%, Facebook up 8%, and Apple up 5%. This resulted in the QQQs being up 5.5% for the week. That kind of price action and frenzied buying harkens back to another time in tech, with a painful outcome. In fact, all the recent buying has pushed the QQQs to three standard deviations above its 50-day moving average of 109.40. Much of this buying is presumably done with borrowed money and the reversal should be nasty. Financial Engineering 101 There is also unprecedented leverage among companies in the S&P 500 and they are using borrowed money from corporate debt offerings to fund dividends and buybacks. Dividends, to help offset the Feds ZIRP and make their shares more attractive to income investors and buybacks to boost EPS and share price returns. In Q1 of 2015, S&P 500 companies actually returned more money to shareholders than they earned. According to Howard Silverblatt, senior index analyst at S&P Dow Jones Indices, S&P companies spent $237.69 billion on dividends and [the majority] in buybacks while reported operating earnings were just $228.36 billion. The only other time this occurred was in Q4 of 2008 (when the entire S&P’s reported a loss for the quarter). S&P estimates that dividends paid (if reinvested) combined with buybacks accounted for 35% of the buildup in the S&P 500 since 2009 (just buybacks accounted for 21%). Corporations buying back their shares represent the single largest buyer in the market today: One example is Microsoft. All may appear rosy for the company but over the last decade, they’ve spent 19% more on stock repurchases and cash dividends than its total net income. That choice of capital allocation speaks volumes on what MSFT sees for their future prospects, in our opinion. When the easy credit spigot gets turned off, this trend will come to an end and probably reverse-much of the repurchased stock will be sold back into the market through follow-on offerings (at much lower levels) as companies race to raise cash quickly. China Much of the growth thesis for many of these tech companies is in emerging markets and most notably China. Our markets have so far shrugged off the crash in the Chinese markets. If nothing else, their collapse shows what can happen to assets that are purchased with excessive margin and enabling government policies. We don’t yet know the extent to which their consumers will be affected by the market collapse (at one point $3 trillion was wiped out). And with the ‘remedies’ the Chinese government is experimenting with (jailing short sellers, ‘suspending’ institutional sales, shutting down trading in different securities haphazardly) should make things worse. Lastly, to go along with the regulatory scrutiny from Europe, China could very easily start making it more and more difficult (or more likely expensive) for tech companies to operate there, especially the worse their economy gets. We’ve seen China’s stock market collapse, when the real estate market follows suit (and all the ‘wealth management products’ blow up) things in China may get a lot worse, for everyone. IPO Market A fascinating statistic of money losing IPO’s by sentiment trader.com revealed that through May of this year, 78% of U.S. IPOs had negative net incomes over the prior 6-month period. That is an astounding number considering that it finally surpassed the former record (76%) from July 2000. So by one measure of market optimism, questionable IPOs, we’ve topped the tech bubble. Many of the IPO’s that have come to market today are led by arguably the most uncertain of all, biotechs. Healthcare and biotech stocks make up almost 16% of the ETF. With the M&A activity (realized and anticipated) in those sectors you have to wonder if we’re close to a top in biotech-it certainly appears so. Unicorn Sightings The manic fever that surrounds technology may be most evident in the venture capital space. A private company valued at $1 billion used to be so rare, it was referred to as a “unicorn”. Now there are over 50 of them. The approximate valuations for some of the largest unicorns, Uber ($40 billion, a ten-fold increase in 2 years), Airbnb ($20 billion), Snapchat ($15 billion) and Pinterest ($11 billion) is beyond ‘frothy’, it’s getting absurd. It will be interesting to see where these companies are valued if they choose to go public. Box Inc. (NYSE: BOX ) and Hortonworks Inc. (NASDAQ: HDP ) both came public this year at valuations below their last private financing round. For now, all is well in Silicon Valley and time will tell if there is another tech crash around the corner. One barometer is San Francisco real estate. The current booming real estate market in San Francisco is a by-product of all the Silicon Valley mania and is sending as clear signal as the unicorn’s crazy valuations. The median home price in San Francisco recently hit $1.225 million, another new record . Relative Weakness We can see that the QQQs have been relatively weak in comparison to the NASDAQ Composite as a whole. It looks unlikely that the ‘blue chip’ NASDAQ-100 will take out the old highs and this negative non-confirmation is a worrisome sign for QQQ: (click to enlarge) (click to enlarge) QQQ price target Our ‘base case’ has a 12-month price target for QQQ of $91.00 which represents an approximate 20% discount to the current share price of around $114. This is also right around the level the QQQs found support from last October’s low. We consider this downside conservative. The QQQ’s dropped 83.6% from the 2000 high to 2002 low and 54.5% from its 2007 high to its 2008 low. We believe the market is just as vulnerable now as at those prior peaks and a simple average of these two sell-offs would imply the QQQ’s trading again down to about $36. We are not suggesting this is a level we’ll see anytime soon but we do believe the QQQs could drift towards that level over the next few years if a less-likely ‘worst case’ scenario unfolds (the overall market rolls over in another major crisis). Catalysts The main catalyst could be an earnings miss or timid guidance from one of the big tech announcers this week. A definitive break of the 200-day moving average (currently around $105.25) should really accelerate the selling towards our target. The major components are so overbought that the “reason” will simply be the unwinding of very crowded trades. A lot of fast money has come into the component stocks in the ETF and will leave just as quickly when margin calls begin and funds look to sell off their most liquid positions to raise cash. Quick Recap NASDAQ-100 currently three Standard Deviations above 50-Day Moving Average. Unprofitable IPOs (back above 2000 levels). All-Time High Margin Levels (82% above the tech bubble high in 2000). Unprecedented dividend payouts and buybacks. Persistently Low Mutual Fund Cash Levels. New high for San Francisco median home prices. Summary Maybe none of these indicators should alarm you, but taken together, the puzzle pieces are starting to show a picture of excessive risk in the tech sector and the QQQs. Given the concentration risk, especially with all the earnings expected this week, and with the recent rush into the major components of the ETF, we see this as a prime opportunity to sell or hedge QQQ positions. One option that can hedge QQQ exposure for six months is the QQQ Jan ’16 $115 puts (the last sale is $5.35 as I write). It is always difficult to think of the downside when stocks are flying and the general sentiment is so rosy. But when that sentiment gets to unprecedented extremes, like today, we believe it’s prudent to go against the grain and hedge positions and/or raise cash. Investors may dismiss these indicators since many have been elevated for some time but that doesn’t make them any less dangerous. We may be early with this sell call, but we’d rather be a little early than late. Editor’s Note: This article discusses one or more securities that do not trade on a major U.S. exchange. Please be aware of the risks associated with these stocks. Disclosure: I/we have no positions in any stocks mentioned, and no plans to initiate any positions within the next 72 hours. (More…) I wrote this article myself, and it expresses my own opinions. I am not receiving compensation for it (other than from Seeking Alpha). I have no business relationship with any company whose stock is mentioned in this article. Additional disclosure: This article is for informational purposes only and is not an investment recommendation of any type. I/we are not a registered investment advisor.