Tag Archives: seeking-alpha

SPDR Barclays Capital High Yield Bond ETF: Great Yields And An Intelligent Portfolio

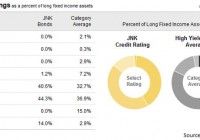
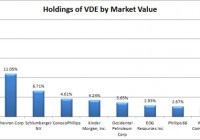
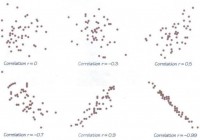
Summary The SPDR Barclays Capital High Yield Bond ETF is a junk bond fund that offers a fairly strong yield, around 6%. One concern is that 14% of the debt is not rated. The exposure to debt that is not rated may be an acceptable trade-off for the strong yields as long as the portfolio managers are doing their own due diligence. The maturities look fairly reasonable and holdings are not highly concentrated, so the overall portfolio construction looks solid. Investors should be using more than junk bonds in their investment portfolio. Correlation to the S&P 500 is a problem for junk bond ETFs. The SPDR Barclays Capital High Yield Bond ETF (NYSEARCA: JNK ) is a pretty good bond fund for exposure to securities ranging from BB to “Not Rated,” though nothing in the portfolio is actually rated anything less than B. The credit ratings won’t be stellar on a junk bond fund and the fund sure doesn’t try to hide it. Their ticker symbol of JNK is simply a play on “junk.” Every buy should know going in that they are buying credit sensitive debt securities. Credit Quality The allocation here seems is perfectly reasonable with the exception that a large amount of not rated bonds is slightly concerning: (click to enlarge) While I would like to have ratings on all or almost all of the debt being held, I can see how having debt that is not rated may be an advantage in producing higher yields if the portfolio managers are willing to do the due diligence to determine what the most likely rating would be if it were rated. In my opinion, this is an acceptable trade-off when most funds have weak yields and JNK is yielding around 6%. In a normal interest rate environment investors may expect materially higher yields, but in the weak yield environment we are all living through, this is one of the higher yielding debt options. Holdings I prepared the following chart showing the largest debt holdings of JNK. (click to enlarge) No problems are jumping out at me. Nothing was over .6% of the portfolio and within the top 10 I don’t see any duplication of the same issuers so I have no reason to expect a concentration of credit risk with individual issuers. Since about 14% of the portfolio was non-rated, it felt more important to double check for any large holdings that might be attributed to one non-rated company. Maturities I grabbed another chart to show the maturity ranges across the portfolio: (click to enlarge) The maturity profile for the SPDR Barclays Capital High Yield Bond ETF looks good for a junk bond fund. However, I must admit that the tiny allocations to the very long-term debt are interesting. Yes, there are generally lower than the category averages but I assume that the category averages may be influenced by a few funds classified into the category that have different investing strategies. Simply put, this is a little strange because it feels like the managers by operating outside of their area of expertise (evaluating short-term credit sensitive debt). On the other hand, these longer securities may simply be bargains they came across while doing their regular work. With it being such a small percentage of the portfolio, I don’t think it is worth worrying about. On the whole, JNK gets a solid rating on providing some diversification across the maturities without becoming too dispersed. There is not one “right” answer about how to structure the maturities, but I like the arrangement shown here. Risk The biggest risk factor from a portfolio standpoint that came up for me was a strong correlation (over 70%) in monthly returns with the S&P 500. Since one purpose of the bond portion of the portfolio is to provide diversification, it is a strike against junk bond funds that they tend to move with the market. That is a problem that should be impacting most junk bonds though, not a risk unique to JNK. When comparing JNK to other junk bond funds, this should not be held against it. Expense Ratio The expense ratio isn’t awful at .40%, however, I still want to keep looking for options where the ratio is lower. Given the relatively low yields on bonds currently and the need to buy junk bonds to get a solid yield, it really hurts to give up a significant portion of the assets to the expense ratio each year. Conclusion If an investor is looking at the role of the bond fund in their portfolio, it would be wise to consider having multiple bond funds if the first one is going to be investing in junk bonds. This kind of fund can offer some diversification benefits to investors, but it would be most productive in a portfolio that combines it with a few other bond funds with different duration exposures and higher credit ratings to enhance the diversification benefits that bonds bring to the investor’s portfolio. When it comes simply to selecting which junk bond fund an investor should use, JNK seems like a decent choice. I’ve still got quite a few funds to consider, but I’m not seeing any major failings here so far. I’m looking for a similar ETF with a very low expense ratio to really stand out as a junk bond fund champion. Disclosure: I/we have no positions in any stocks mentioned, and no plans to initiate any positions within the next 72 hours. (More…) I wrote this article myself, and it expresses my own opinions. I am not receiving compensation for it (other than from Seeking Alpha). I have no business relationship with any company whose stock is mentioned in this article. Additional disclosure: Information in this article represents the opinion of the analyst. All statements are represented as opinions, rather than facts, and should not be construed as advice to buy or sell a security. Ratings of “outperform” and “underperform” reflect the analyst’s estimation of a divergence between the market value for a security and the price that would be appropriate given the potential for risks and returns relative to other securities. The analyst does not know your particular objectives for returns or constraints upon investing. All investors are encouraged to do their own research before making any investment decision. Information is regularly obtained from Yahoo Finance, Google Finance, and SEC Database. If Yahoo, Google, or the SEC database contained faulty or old information it could be incorporated into my analysis.

Vanguard Energy ETF: Should You Take A Dose Of Oil?

Summary Oil companies seem like a solid natural hedge against higher oil prices and the negative impacts oil prices can have on the economy. VDE has heavy concentration in one company, but I like that holding. The big surprise for me was that high correlation between VDE and the rest of the domestic market. Due to volatility and the high correlation, it appears very difficult to use VDE to reduce total portfolio risk. The low expense ratio is great, but that is not enough to get me to buy into an ETF. When I started looking at the Vanguard Energy ETF (NYSEARCA: VDE ), it looked like a natural fit for my portfolio. The fund is offering diversification while buying up the big oil companies. When it comes to oil, my theory is simple. Holding oil should be a natural hedge to some of the other risks in the economy. When oil prices are doing great, the rest of the economy should be hit by higher gas prices that reduce the amount of capital for consumers to spend at other businesses. The cost of doing business for corporations that rely on physically moving assets should be higher which would compress margins. It is reasonable to assume that VDE should be a great hedge for some of the portfolio risk. I have a bias towards buying high-quality ETFs when I see their prices “dip”. Lately that has been great for me as it has helped me acquire better prices on several of the ETFs I’m holding. On the other hand, if we were to have another major recession where the market fell by 40%, I would’ve been all in by the time the market was down to 5% to 10% and scrambling to get more dry powder to buy more shares when prices were even lower. Largest Holdings The diversification within the ETF is terrible. That sounds like a huge problem, but in this rare case it is not a major issue. If I was going to buy one company to try to hedge against higher oil prices, I would probably pick Exxon Mobil (NYSE: XOM ). That is running around 21% of the portfolio of VDE, as shown below: (click to enlarge) Since XOM is one of the first companies I would want to add to the portfolio, I see VDE as offering diversification for 79% of the investment. From that perspective, the diversification adds a fairly solid benefit relative to only holding one of the major oil producers. When I’m comparing the concentration to the other ETFs I choose, there is no way I would accept so much concentration in any of the other ETFs. Surprises When I ran the statistical analysis over the last 5 years, I was surprised to see the results. I expected oil to appear fairly volatile after the problems the oil market has seen in the last year. Despite expecting some volatility, I wasn’t expecting these results. (click to enlarge) When I ran the ETF through InvestSpy to check the statistics, the high beta stood out to me. I was expecting a lower beta for the ETF, because I thought the correlation would be lower. Instead, using the last 5 years, the correlation was running at 84%. To run some quick math, when the volatility is almost 50% higher than SPY and the correlation is greater than 80%, you’re not going to find any diversification benefits showing up in the statistical analysis relative to just holding SPY. Regardless of how small the weight was for VDE, it would hurt the total portfolio volatility unless the starting portfolio was very strange. To demonstrate that point, I ran a sample portfolio that was 99% Vanguard Total Stock Market ETF (NYSEARCA: VTI ). I use VTI for a substantial portion of my portfolio because I value the diversification. I’m not using it as 99%, but I think this demonstrates precisely the challenge in using VDE. (click to enlarge) When an ETF is only used for 1% of the portfolio, even high levels of volatility can be dealt with by simply diversifying away the risk. However, the high correlation between VDE and the domestic U.S. market is preventing it from gaining those benefits. Double Dipping on Exposure The simplest argument for VDE having such a high correlation with the total stock market ETF and with the S&P 500 would be that XOM is already an enormous company and thus it is influencing both ETFs. However, the problem with that argument is that XOM is only 1.53% of the VTI portfolio. Expense Ratio The expense ratio is only .12%, which is a good reasonable ratio. Unfortunately, a low expense ratio is not enough by itself to get me to invest in a fund. Conclusion I like the idea of increasing my oil exposure and regularly rebalancing the position after seeing how far some of the sector has fallen. Despite that desire, the combination of volatility and correlation makes it much harder for me to justify using a heavy exposure to the sector. Perhaps I need to measure the returns over longer sample periods such as quarters at a time to test for lower correlation levels. That might reduce the correlation of returns, and I’m more likely to assess the performance of my portfolio on a monthly or quarterly basis. I look for opportunities to invest more often than that, but I don’t want to sweat minor changes. Disclosure: I am/we are long VTI. (More…) I wrote this article myself, and it expresses my own opinions. I am not receiving compensation for it (other than from Seeking Alpha). I have no business relationship with any company whose stock is mentioned in this article. Additional disclosure: Information in this article represents the opinion of the analyst. All statements are represented as opinions, rather than facts, and should not be construed as advice to buy or sell a security. Ratings of “outperform” and “underperform” reflect the analyst’s estimation of a divergence between the market value for a security and the price that would be appropriate given the potential for risks and returns relative to other securities. The analyst does not know your particular objectives for returns or constraints upon investing. All investors are encouraged to do their own research before making any investment decision. Information is regularly obtained from Yahoo Finance, Google Finance, and SEC Database. If Yahoo, Google, or the SEC database contained faulty or old information it could be incorporated into my analysis.

Correlated Risk? Or Opportunity?

In my weekend research report I write for my clients, I shared a few thoughts on correlation. This is a timely topic-we may be entering a period of the market history where a lot of assets link together. This is a risk, as there’s always the risk of getting smacked in the face when (previously) non-correlated markets snap into lockstep, but there’s another side to this, as well. Correlated risk can drive exceptional performance, for those traders who understand the risks, can fully accept those risks, and manage them appropriately. Here’s the snippet I wrote over the weekend: (click to enlarge) Correlation is a concept that is often misunderstood and much-abused in thinking and writing about financial markets. This week, we need to devote a few words to the concept of correlated risk and how to manage these risks, but, first, a few thoughts on correlation and some potential issues with the measure: Think carefully Correlation is well-understood mathematical measure, but, as in so many cases, applications to financial markets can often encourage sloppy thinking. On one hand, perhaps too much attention is focused on correlation, and this is likely a side effect of correlation’s importance in constructing portfolios; expected future correlation of assets is one of the key inputs in portfolio models, and here we arrive at one of the first issues. Few people, outside of those who have done quantitative work and study on financial market data, appreciate how variable correlations can be. Stocks are put into portfolios with the idea that they are “high beta” or “low beta” (beta is a measure of the amount of a stock’s movement that is attributable to the broad market), but, depending on what time window we measure, a stock’s beta might fluctuation between 2.0 and -1.0 within the course of a few years. Even supposedly well-established rules of thumb, such as the Dollar’s correlation to other asset prices, stock markets’ volatility’s (inverse) correlation to price movements, are highly variable. Furthermore, correlation does not show what most casual market participants might expect. It is easy to look at two lines on the chart that go in roughly the same direction and say “they must be highly correlated.” Maybe, but maybe not. Correlation can be highly deceptive when extrapolated to other time periods; it is trivial, for instance, to construct two price series that are perfectly -1.0 inversely correlated, yet both “go up” over a longer time period. (See this blog post for an example.) Last, two points that will be familiar to readers with a mathematical background, but that bear repeating: correlation does not imply causation. Every statistics student learns this in the first class she takes, but we are all vulnerable to drawing unsupportable conclusions in the heat of battle; we cannot hear this reminder too often. Second, correlation measures linear relationships. In many cases, linear correlation has application to non-linear relationships, but just be aware that relationships between markets could potentially be much richer and more complex than could be captured in a measure of correlation. Correlated portfolio risk These points are interesting (and important), but the practical issue of correlated risk demands attention. Put very simply, we put on different positions in a trading book or portfolio with the idea that they are all independent bets-some may win, some may lose, but they will each “do their own thing.” Correlated risk is the risk that, for some reason, all of these positions move in the same direction at the same time. Why might this happen? It is well-established, through decades of market history, that correlations tend to move toward 1.0 in times of market stress . These are not rare events; they happen several times each decade when supposedly unconnected assets all move in the same direction, usually led by mini-crashes in stock prices. In retrospect, there’s always some “obvious” connection, but psychology is the driver. Market participants become scared and basically scramble for the exits all at the same time. However, risk is a double-edged sword, and one of those edges works for us. Risk is the companion of opportunity, and, in fact, we can reduce our job to taking on the right kinds of risk and managing them appropriately. Over a long period of time, many traders find that their returns tend to be concentrated in certain time periods; this is true both of discretionary traders and of trading systems in test and design. During these periods, risks tend to high and correlated, but there is an important lesson here. Accepting these correlated risks can lead to outsized returns. We may wish it were otherwise, but trading and investing are uncertain games of chance. We may wish for steady returns and a rising equity curve that looks like a straight line (or an exponential curve), but reality is messier. Reality is periods of feast and famine, and correlated risks typically are high in the rich periods. We should be aware of these risks and manage them, but we should see them for what they are-a real risk with real potential rewards and, potentially, a major driver of potential outperformance.