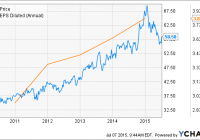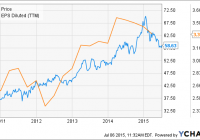
Summary Midwest electric and natural gas utility holding company Alliant Energy has seen its share price drop since May due to a relatively weak Q1 and bearish sector sentiment. The company’s future earnings growth looks attractive due to the presence of strong state economies in its service area and compelling arguments for new electric generation capacity. While its shares appear to be fairly valued following the recent price decline, I believe that warm winter weather resulting from El Niño conditions could make them undervalued. Short-term uncertainty aside, however, I am optimistic regarding the company’s long-term earnings potential due to its geographic location and favorable regulatory developments. The share price of public utility holding company Alliant Energy (NYSE: LNT ) approached its 1-year low last month, following both its trailing EPS (see figure) and share prices in the broader utilities sector lower in the process. The company’s share price is now trading 17% below its YTD and all-time high. While the sector has been hit by bearish sentiment of late as investors have moved away from utilities in anticipation of higher bond yields being available later in the year, Alliant’s recent downturn makes its shares look more attractive than at any other point in the last several months. This article evaluates the company as a potential long-term investment. LNT data by YCharts Alliant Energy at a glance Alliant Energy is a Wisconsin-based public utility holding company that has operated in its current form since 1981. It operates two primary subsidiary regulated utilities, Interstate Power & Light [IPL] and Wisconsin Power & Light [WPL]. IPL generates electricity and distributes electricity and natural gas to customers in Iowa and southern Minnesota. WPL provides the same services in Wisconsin. Between them, the two subsidiaries have a total of 1 million electric customers and 420,000 natural gas customers. Their combined electric generation capacity is 30 million MWh per year with a maximum peak hour demand capacity of 5,426 MW, and their annual natural gas sales and transportation volume was 123,446 thousand dekatherms in the most recent fiscal year. The electric generation capacity is divided between coal, natural gas, and renewables (primarily wind), although the combined capacity of the latter two has grown significantly over the last decade at the expense of the former. This trend is to continue over the next decade as the company replaces roughly 50% of its current coal capacity with additional natural gas and wind capacity. Alliant Energy is in the process of investing heavily in this new capacity. The natural gas capacity will take the form of two 650 MW combined cycle natural gas facilities costing a total of $1.7 billion, the first of which is expected to come online in FY 2016 (followed by the second in FY 2019). These two facilities will replace expired purchase power agreements as well as existing coal-fired capacity, thereby both reducing the company’s emissions and increasing its earnings potential. Additional capacity is expected to bring the company’s total investment to $2.5 billion by 2023. Of the two primary utilities subsidiaries, IPL is slightly larger than WPL, generating 56% of their combined operating revenue in FY 2014. Alliant Energy also owns a Resources segment that oversees non-regulated transportation services, including rail transport, barge transport, and 1.3 million tons of coal terminal capacity. Finally, the company has a 16% stake in American Transmission Company [ATC], which provides electric transmission services in Wisconsin and Michigan’s Upper Peninsula. ATC operates under a very favorable regulatory scheme with an allowed ROE of 12.2% on its 50% equity share. While it is currently operating from a relatively small base, it will likely experience company-beating earnings growth due to its relatively high ROE resulting from its investment in several transmission projects located in the western U.S. as part of a joint venture with Duke Energy (NYSE: DUK ). Alliant Energy has also been paring its less-profitable assets as a means of partially-financing its large planned capex over the next several years. This effort recently saw the company close on the sale of its Minnesota gas distribution assets for a total of $13 million in cash and promissory notes as well as the planned sale of IPL’s Minnesota electric and gas distribution assets for a total of $140 million. The loss of the Minnesota electric distribution assets will be partially offset by wholesale power agreements with their purchaser. Alliant Energy has been one of the regulated utility sector’s better performers since the end of the financial crisis, delivering a combination of earnings growth and steady dividend increases, the latter by as much as 8.5% annually (see figure). This record has been due in large part to its geographic footprint, with its service area being limited to states that fared very well during the Great Recession. Iowa, Minnesota, and Wisconsin largely missed out on the surging real estate market in 2005 and 2006, one effect of which was that they also managed to avoid the worst effects of the subprime mortgage crisis. Meanwhile, the recession did not hit the states hard due to their heavy exposure to the farm industry, which benefited strongly between 2008 and 2013 from rising biofuel blending requirements both at the state and federal levels. Furthermore, whereas old corn ethanol facilities largely depended on coal to provide process heat and power, newer facilities built after 2008 turned to natural gas instead to comply with federal regulations, boosting demand for Alliant Energy’s natural gas distribution services as corn ethanol capacity grew strongly (Iowa, Minnesota, and Wisconsin are three of the country’s largest producers of corn ethanol). Abnormally cold winters in recent years and a propane shortage in 2014 provided a further boost to the company’s earnings. LNT Normalized Diluted EPS (Annual YoY Growth) data by YCharts Q1 earnings Alliant Energy reported mildly disappointing Q1 earnings results at the end of Q1 that missed on both lines despite the presence of favorable operating conditions during the quarter. Revenue fell by 5.8% YoY from $952.8 million to $897.4 million, missing the consensus estimate by $10.7 million. The decline compared to the previous year was attributable to a combination of lower energy prices following last autumn’s big price decline and the presence of weather during the quarter that was warmer than in Q1 2014, albeit still colder than the long-term average. The company’s consolidated electric revenue fell by 0.6% YoY while its natural gas revenue dropped a substantial 17.6% over the same period. Electric sales volume declined by 2.9% YoY as the previous year’s propane shortage, which caused many customers to temporarily switch to electric heaters, disappeared, while natural gas sales volume decreased by 10.4%. Overall Q1’s weather was “only” 10% colder than the long-term average as compared to 20% colder than the long-term average in Q1 2014. The company’s operating income fell by only 0.8% YoY despite the revenue drop due to a 9.6% decrease to fuel costs resulting from low coal and natural gas prices. Net income fell to $96.6 million from $108.0 million the previous year. This resulted in diluted EPS of $0.87 versus $0.97 the previous year, missing the consensus estimate by $0.04. The EPS contained a mixed bag of information for the company’s investors. The relatively warm weather compared to the previous year reduced the result by $0.08, although it would have been lower still by another $0.04, had temperatures been closer to the long-term average. Changes to Alliant’s purchased power agreements boosted EPS by $0.13 compared to Q1 2014, however. IPL was a strong performer during the quarter, increasing its share of the company’s consolidated diluted EPS from 40% the previous year to 49%; WPL’s share fell to 46% from 51% over the same period. The strong quarterly performance caused Alliant’s balance sheet to strengthen as its operating cash flow increased by 7.2% YoY to $314.7 million. It ended the quarter with cash of $97.6 million and assets of $12.1 billion, up YoY in both cases from $14.5 million and $11.1 billion, respectively. The company’s balance sheet is not prone to the volatility experienced by those of many of its peers due to the very hot weather commonly experienced in its service area during Q2, with 170 degree temperature swings (including wind chill and heat index) not being unheard of in Iowa between Q1 and Q3. Even accounting for this relative lack of seasonality compared to those utilities that only experience earnings boosts either in Q1 (in northern geographic regions) or Q3 (in southern geographic regions), Alliant’s balance sheet still strengthened noticeably, with its current ratio improving to 0.9 from 0.68 in Q1 2014. The company has a moderate amount of long-term debt on its books at $3.6 billion, although this is available at low interest rates due to its very good credit rating (ranging from BBB+ to A). Management felt comfortable enough with its financial position in the quarter to increase the company’s quarterly dividend by an impressive 8.5% to $0.55, representing a forward yield of 3.7% at the time of writing. Alliant Energy Financials (non-adjusted) Q1 2015 Q4 2014 Q3 2014 Q2 2014 Q1 2014 Revenue ($MM) 897.4 804.1 843.1 750.3 952.8 Gross income ($MM) 427.5 397.5 476.5 385.7 438.1 Net income ($MM) 96.6 60.0 153.3 61.8 108.0 Diluted EPS ($) 0.87 0.54 1.38 0.56 0.97 EBITDA ($MM) 266.5 206.2 311.9 218.7 271.9 Source: Morningstar (2015) Outlook Alliant Energy’s short-term outlook is bright, although weather-related impacts could provide a headwind (this is very uncertain at this time, however). With a substantial cash reserve, $934 million in available liquidity from existing credit facilities, and pending asset sales, Alliant will have no difficulty financing its near-term planned capital expenditure. This will reach $1 billion in FY 2015, including $300 million in new capacity investments. Management reaffirmed its FY 2015 diluted EPS guidance of $3.45 to $3.75 during its Q1 earnings call which, in addition to representing a 4% increase over its FY 2014 earnings if the middle of the range is achieved, would also provide sufficient operating cash flow to proceed with the company’s planned capital expenditures. This capex in turn will drive rate base growth of 4% and 6% CAGR for IPL and WPL, respectively, through FY 2017. Given Alliant’s current favorable allowed ROEs of 10% and 10.4% for IPL and WPL, respectively, plus a sharing mechanism for WPL ROEs of up to 11.4%, management’s goal of 6% EPS growth will be achievable. The main short-term risk that Alliant Energy faces to its short-term earnings growth is presented by the prospect of El Niño conditions during the coming winter. These conditions are expected to begin manifesting themselves this autumn and, if pronounced enough, they could push the polar jet stream during the winter further north than usual. This would result in warmer weather across the company’s service area during Q4 2015 and Q1 2016, reducing demand for natural gas and, to a lesser extent, electricity. Furthermore, the lack of temperature fluctuations could also reduce the availability of wind power in the Central Plains, possibly extending to Alliant’s wind capacity. Weather forecasts are notoriously inaccurate – to quote Niels Bohr, “Prediction is very difficult, especially about the future” – so investors certainly shouldn’t assume that Alliant’s earnings will weaken this winter. It is a risk to consider, however. In the longer term, however, Alliant’s management has laid out a convincing path to continued steady earnings growth. The economies in its service area continue to exhibit the kind of strength that would make many regions of the U.S. jealous, with Iowa, Minnesota, and Wisconsin all reporting unemployment rates that are well below the U.S. average (see figure). While corn ethanol’s saturation of the U.S. transportation fuel market and a lack of substantial population growth means that natural gas demand in the Midwest is unlikely to increase in the coming years, the presence of continued U.S. blending mandates means that it is unlikely to weaken either. This will support the company indirectly as well in the form of electricity income, as the agricultural/food processing sector was responsible for fully 29% of IPL’s electric sales and 9% of WPL’s electric sales in FY 2014. Iowa Unemployment Rate data by YCharts A combination of weakness in the natural gas market and regulatory opposition to coal at the federal level will support Alliant’s rate base case moving forward as well by making new gas-fired capacity competitive with old coal-fired capacity. Likewise, regulatory opposition to coal will also make wind power more attractive as well. The company, which already has 1,168 MW of wind power, intends to double this by 2028 until wind capacity exceeds that of coal. It is also experimenting with solar power, although that is not as attractive as wind in the upper Midwest. Alliant will be able to make a convincing argument to the relevant state regulators that continued investments in new capacity will not just be necessary to comply with federal regulations but also to deliver the cheapest electricity to consumers, with the subsequent capex supporting rate base increases and earnings growth. Valuation Analyst estimates for Alliant Energy’s future earnings have held relatively steady over the last 90 days due to management’s guidance being reaffirmed at the end of Q1. The FY 2015 and FY 2016 consensus diluted EPS estimates have both increased slightly from $3.62 and $3.82 to $3.63 and $3.83, respectively. Based on the share price at the time of writing of $58.63, Alliant’s shares have a trailing P/E ratio of 17.4x and forward ratios of 16.2x and 15.3x, respectively. All three of these ratios are approximately in the middle of their respective 4-year ranges (see figure), suggesting that the company’s shares are fairly valued at present. LNT PE Ratio (TTM) data by YCharts Conclusion Alliant Energy has benefited over the last several years from operating in a service area with a stronger-than-average economy backed by a resilient farming sector and plentiful wind power. The company’s shares are not undervalued at present despite recent sector weakness, although they do present potential investors with an attractive earnings growth opportunity due to Alliant’s supportive regulatory structure and compelling long-term rate base growth argument. The company’s share price has historically tracked its quarterly earnings, however, and I believe that a more attractive buying opportunity could arise in the event that strong El Niño conditions result in warmer winter weather and diminished wind power in Q4 and Q1. Alliant Energy is one of the regulated utilities sector’s stronger offerings in either case. Disclosure: I/we have no positions in any stocks mentioned, and no plans to initiate any positions within the next 72 hours. (More…) I wrote this article myself, and it expresses my own opinions. I am not receiving compensation for it (other than from Seeking Alpha). I have no business relationship with any company whose stock is mentioned in this article.