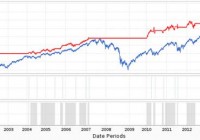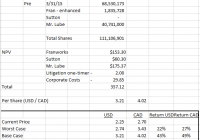
Summary BEVFF’s recent addition of the Mr. Lube royalty stream has allowed the company to increase its yield to 8.2% at current price levels. Even at conservative growth/contraction rates, the NBV of BEVFF’s royalty streams substantially exceeds its current share price, even with the large share issuance financing the Mr. Lube purchase. At higher growth rates, there is significant upside to 105% based on comparable distributable earnings multiples. BEVFF is not understood by investors even in its home Canadian market, based on its low valuation. Diversified Royalty ( OTC:BEVFF ) is a royalty streaming company deriving its royalties from leading multi-location and franchise operations in North America. I detailed the company’s operations involving Franworks and Sutton Realty in my article from June 2015. However, on July 23, 2015, BEVFF added a third streaming component in the form of Mr. Lube trademarks and intellectual property rights acquisition. This acquisition was significantly larger, leading me to revisit BEVFF’s business case. Mr. Lube was founded in 1976, and is Canada’s leading quick service oil change firm. It was the first North American company to enable oil change service without appointment, and has expanded through the use of the franchise model. It has 170 operations across Canada, with 43% in Western Canada, 43% in Ontario and 14% in Quebec and the Maritimes, giving it a broad exposure to the Canadian economy. Oil changes at a reasonable price are as close to a staple for car owners in North America as there is, making it a relatively recession-proof business. 15 straight years of same-store sales growth have taken Mr. Lube through several downturns, proving this point. This low-volatility business, with its franchise model, makes it a good acquisition for BEVFF, as its cash flows will permit a steady income flow that BEVFF can distribute via its dividend policy. Let’s take a closer look. Mr. Lube Acquisition On July 23, 2015, BEVFF acquired the trademark and other intellectual property rights from Mr. Lube for $111.4m USD . In exchange, BEVFF licensed them back for a 99-year term, with an initial annual royalty of $9.9m USD ($12.4m CAD). This fee is linked to Mr. Lube’s system sales, with BEVFF earning its royalty at a 6.95% rate. Mr. Lube has had positive same-store sales growth for the last 15 years, and through the first 6 months of 2015, has grown at an estimated rate of 1.9% . It will also pay BEVFF an annual management fee of $160,000 , which escalates 2% per year. BEVFF also agreed to acquire land worth $9.8m under 4 Mr. Lube locations that it would finance with debt if it could not find an alternative buyer. The company also increased its tax pools by $84m, giving it over $112m in total tax pools to ensure its future earnings remain tax-free. In order to fund this transaction, BEVFF engaged in the following transactions: Issuance of 40,741,000 subscription receipts convertible to common shares with a deemed value of $2.16 USD ($2.70 CAD), totaling $88m USD. Obtaining a $27.7m USD ($34.6m CAD) 36-month term loan with interest, with 50% at a minimum fixed rate of 3.55% and the remainder variable at Banker’s Acceptance + 2.5%. Obviously, this is very dilutive to existing shareholders, with the share count increasing by 58% . Let’s take a look at whether BEVFF got good value for its purchase. Mr. Lube Royalty Valuation I found the best way to evaluate this transaction was using a Net Present Value analysis of its cash flows. I used the following assumptions: A 99-year term Initial royalty payment of $9.9m, which I then escalated with various same-store sales growth (SSSG) rates ranging from -2% to 2%. The management fee of $0.16m, escalated annually at 2%. Interest on the term loan for the first 3 years at a rate of 3.355%, based on the press release. Discounted at 6.67%, representing an S&P multiple of 15x P/E. I excluded the potential land purchase, as it is not core to BEVFF’s business model. I end up with some very compelling valuations behind this: NPV of Mr. Lube Deal at Various Same-Store Sales Growth Rates SSG Growth Rate Net Present Value 2% $210.7m 1% $175.4m 0% $149.9m -1% $130.8m -2% $116.9m This is obviously very accretive compared the purchase price. With the access to funds that Mr. Lube now has to both open new stores and refresh old ones, a base case of 1% makes the most sense, especially compared to its 15-year track record of growth. In the worst-case scenario at -2%, it still provides some marginal value compared to its purchase price. Obviously, this model is sensitive to the duration (99 years is a long time and of similar duration to Sutton’s). However, using a base case of 1%, if Mr. Lube only goes out 19 years, its NPV will still exceed the purchase price today. Obviously, this deal appears to be very lucrative for BEVFF in terms of acquiring a strong cash flow stream. I now want to roll this up into the rest of BEVFF’s operations, including looking at a worst-case scenario and a best-case scenario. I will also confirm this valuation by comparing its multiple based on its distributable earnings. And finally, I want to confirm that the dividend will be sustainable. BEVFF – Discounted Valuation In order to evaluate BEVFF, I did an NPV on each revenue stream, as well as one for the corporate charges required to sustain the corporate entity. I used the following assumptions: For Mr. Lube, I used 1% growth as the base, with 0% the worst and 2% the best case. In the Mr. Lube acquisition press release, it denoted that Franworks’ SSSG in Q2 had fallen by -1.8% year-over-year due to a fall off in the Alberta economy, but was offset by gains on the USD sales from its US restaurants. However, it guided to $2.7m USD in revenue, which outpaced the base we used in our model. As a result, I will use 0% growth as our base, -1% worst and 1% best case. Sutton’s results are largely fixed in nature. I assumed corporate costs at $2m USD annually. The last quarter’s was at $0.4m USD, so this seems in line; I will increase it to $2.5m for the worst-case scenario and use a perpetual discounting on it. I assumed litigation costs of $2m USD as a one-time cost related to the legacy John Bennett litigation. I will discount it the entire model at 6.67% , the same as in the Mr. Lube standalone scenario. After all this, we end up with a very compelling case for BEVFF at its current price levels of $2.25 USD and $2.70 for its Canadian listing DIV.TO: From a DCF perspective, the current valuation of DIV gives it a compelling upside, even in the worst-case scenario, with returns ranging from 22% to 68%. BEVFF – Distributable Earnings Methodology With now three defined royalty streams, BEVFF is well on its way to emulating one of the kings in the royalty sphere, Alaris Royalty ( OTC:ALARF ). In order to evaluate BEVFF, I decided to use the same methodology that Baron Investing did in his article on the above company, 24x 2016 earnings as used by Morningstar. This best reflects the steady distributions that shareholders can expect to see from the company going forward. I will utilize year 2’s results, which exclude the one-time litigation costs expected in the coming year, as a more normalized number. Applying the 24x multiple with the outstanding share count of 111,106,901, we end up with a share price of $4.60 USD – an upside of 105% from its current level. Currently, it is trading at less than 12x distributable cash. Dividend Sustainability If we look at the same chart above, we can see that the dividend coverage compared to cash flow is high in year one, largely due to the litigation costs which should be completed by the end of Bennett’s trial in 2016. I forecast BEVFF to have ample cash to cover these one-time costs. After that, the company has good coverage levels going forward, even with the increase to $0.2225 CAD ( $.178 USD )/share. This gives it a dividend yield of 8.2% at current prices. I project BEVFF to have $12.8m in cash after accounting for this deal, giving it some margin of safety in maintaining the dividend. However, the security of its streams make this highly unlikely. Risks The biggest risk I see is how BEVFF intends to satisfy its debt obligations. Both the Sutton and Mr. Lube purchases involved taking on term loans for three-year periods. However, they are non-amortizing, so principal payments are deferred until 2018. At that point, the company may be able to finance at a higher share price or it will be able to renegotiate the loan. The forecasted $12.8m cash on hand would also help to settle these obligation; by delaying the debt payments with a very reasonable interest level, BEVFF should be able to fund almost half of its obligations with cash on hand before it re-finances itself, excluding any further activity. I suspect that the company will continue to acquire further royalty streams in the future, using ALARF as a model. Exposure to the Canadian economy is also a risk, as you have exposure to the Canadian consumer (Mr. Lube), real estate (Sutton) and the Alberta economy (Franworks). The reduced SSSG at Franworks in the Q2 comments show this risk, as it has been impacted by the oil & gas shock in Alberta. However, all are strong brand names which have survived through downturns before. Catalysts I believe the biggest catalyst will be the market’s understanding of this deal. The large share issuance has likely obscured the ability of the market to judge the value of BEVFF, as the share price has drifted right down to the subscription price prior to this deal occurring, making it essentially non-dilutive. Even on Seeking Alpha itself, this company is not well understood. Evidently, it was involved in soil remediation at some point: It is also very much under-followed, as myself and 18 other Basic alert subscribers can attest to: (click to enlarge) I believe management will continue to look for further royalty deals; however, I suspect they will be of smaller scale than the Mr. Lube deal. I forecast BEVFF’s current debt-to-equity ratio to be at just 20% post-deal, with none of it due for 3 years. I think they will want to do further deals with equity issuance going forward, with the only cost being an ongoing dividend payment. This is from Alaris’ playbook as well, as Alaris carries no debt on its books currently. Outperformance by its underlying royalty companies will also help to drive performance of the streams themselves. Mr. Lube now has some large funding to put to use, and an already planned expansion of 15 new stores which could provide some increased growth short term; growth is never in a straight line, though, unless you are Bernie Madoff. This would potentially allow the dividend to continue to rise, as management seems comfortable paying out close to 100% of distributable earnings – which, by year 2, it will clearly have the capacity to do so. The alternative is to settle its debt obligations early; either way, shareholders win. I think it is a great time to take advantage of a short-term market dislocation in valuing BEVFF’s underlying royalty streams. By either valuation metric, there is substantial upside, even if some of its underlying royalties begin to contract. And while you wait, an 8.2% dividend yield doesn’t hurt. Editor’s Note: This article covers one or more stocks trading at less than $1 per share and/or with less than a $100 million market cap. Please be aware of the risks associated with these stocks. Disclosure: I am/we are long THE CANADIAN TICKER DIV.TO. (More…) I wrote this article myself, and it expresses my own opinions. I am not receiving compensation for it (other than from Seeking Alpha). I have no business relationship with any company whose stock is mentioned in this article. Additional disclosure: Due to the low volume of BEVFF, if you are taking a position, it is advisable to do so in the Canadian ticker “DIV” as it is substantially more liquid