Tag Archives: power

American Electric Power Retains Attractiveness For Dividend Seekers

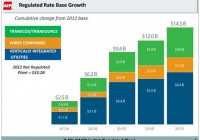
Summary AEP could sell competitive energy operations if weakness continues to persist in the segment’s performance despite long-term pricing agreements. AEP’s capital expenditures will fuel rate based and bottom-line growth in coming years. Stock’s dividend yield of 3.6% is backed by its cash flows. American Electric Power (NYSE: AEP ) has remained an admired investment option for dividend-seeking investors due to its high dividend yield, which is backed by its cash flows. Also, the company is expected to experience healthy earnings growth in the future, driven by capital expenditure that AEP is making to expand its transmission operations. The company expects to experience regulated rate base growth of 7.5% on average until 2017. Separately, AEP has been considering several options to address challenges faced by its competitive energy operations, including the sale of competitive assets, which will positively affect its bottom-line numbers growth. Earnings growth due to the expansion of regulated energy operations will improve bottom-line growth, and hence strengthen cash flows, which will support dividend growth for AEP in the coming years. Therefore, I believe AEP will deliver a healthy financial performance in 2015, which will positively affect the stock price. Healthy Growth Outlook AEP has made the correct strategic decision to address challenges faced by the company in the competitive energy segment; the company’s competitive energy operations have been adversely affected due to low and volatile forward power prices. AEP is looking for a reliable long-term price agreement to stabilize revenues for the segment. And if the long term pricing agreement does not help AEP address challenges faced by the segment, I believe the company will choose to sell its competitive energy assets. The company recently announced that Goldman Sachs will assist AEP in considering options for its competitive energy operations. AEP’s director of external communication, McHenry said, “We haven’t made a decision about whether or not we’re going to sell them, we’re looking at a variety of options.” Duke Energy (NYSE: DUK ) and PPL Corp. (NYSE: PPL ) are among the leading U.S. utility companies that have sold their competitive energy assets due to the ongoing challenges. Along with its efforts to improve competitive energy operations, AEP has been making capital expenditures to grow it regulated operations, which will improve its top and bottom-line growths in the future. The following table shows the capital expenditures that AEP expects to incur from 2015-2017. 2015 2016 2017 Capital Expenditure ($ -billions) $4.4 billion $3.8 billion $3.9 billion Source: Yahoo Finance Also, the company’s regulated rate base growth is expected to increase at an average rate of 7.5% until 2017, due to the capital expenditures it has been making. The increase in regulated operations will also positively affect the stock price. The following chart shows the rate base growth for AEP from 2013-2017. Source: Company Reports Also, the company has been focusing on reducing its costs. AEP has been working to manage and reduce its operational and maintenance costs, which will help offset the weak results of competitive energy operations and support its long-term bottom-line growth. EPS growth for the company is expected to remain in a range of 4%-6% in the long term, as shown below in the chart. Also, the company is expecting its operating earnings for 2014 to in a range of $3.40-$3.50 per share. Source: Company Reports Healthy Dividends The company has been sharing its success with shareholders through dividends. The company offers a dividend yield of 3.60%, which is backed by its cash flows. Also, the company has consistently increased dividends at an average rate of 4% from 2005-2014. The following chart shows the dividend increases for AEP over the years. Source: Company Reports The following table shows the dividend payout ratio and dividend coverage for AEP from 2012-2014 (Dividend coverage = Operating Cash Flows/Dividends). 2012 2013 2014 Dividend Payout Ratio 60% 60% 55% Dividend Coverage 4.1x 4.5x 4x Source: Calculations and Companies Reports As the company has been making efforts to improve its operations through increasing regulated energy operations, its cash flows will be positively affected, which will help AEP increase its dividends at a healthy pace in the coming years. Due to its safe and healthy dividends, the stock remains a good investment option for dividend-seeking investors. Conclusion As competitive energy operations remain weak, AEP has been taking the correct strategic decisions to improve its performance. There is a possibility that AEP might choose to sell its competitive energy operations, if the weakness continues to persistent in the segment’s performance despite long-term pricing agreements. The capital expenditures that AEP is making will fuel its rate base and bottom-line growth in the coming years. And the stock’s dividend yield of 3.6%, backed by its cash flows, makes it a good investment option for dividend-seeking investors. Due to the aforementioned factors, I am bullish on AEP.

Recap: The Best And The Worst In Alternative Investment ETFs

John Bogle, founder of the Vanguard fund family, has cautioned investors for many years about playing cute with their investment portfolios. “Don’t look for a needle in the haystack,” says Saint Jack, “just buy the haystack.” With that, Bogle inveighs against stock-picking and advocates the use of index funds. Why try to beat the market, in his view, since you can’t do it consistently? Not surprisingly, many investment advisors rail against Bogle’s notion. Some, particularly those running endowments and foundations, are duty bound to seek equity-like returns without the concentrated risk of stock investments. Which brings us to alternative investments. Mixing “alts” into a portfolio can, in the best of circumstances, enhance returns and diversify risk. This year, though, alts have had an especially tough row to hoe. Domestic equities, measured by the performance of S&P 500 SPDR ETF (NYSEARCA: SPY ) , gained 15 percent in 2014 with an annualized volatility of 11 percent. As stand-alone investments, only one alt category outperformed the domestic stock market. (click to enlarge) Alts, of course, aren’t meant to be stand-alones; they’re destined, for most investors, to be portfolio adjuncts. Real estate was the standout of the year, offering a one-two combination punch of outsized gain and low volatility. The PowerShares Active US Real Estate ETF (NYSEARCA: PSR ) more than doubled SPY’s return with a smaller standard deviation. All this with a middling correlation to the broad equity market. If you were shopping for negative correlation to equities this year, the shelves were rather bare. Only two ETFs – the SPDR Gold Shares Trust (NYSEARCA: GLD ) and the QuantShares US Market Neutral Value ETF (NYSEARCA: CHEP ) – cranked out negative coefficients against SPY. And the price for this? Negative returns, though arguably you could say GLD had a breakeven year. If you base your diversification success on the Sharpe ratio – a gauge of risk-adjusted returns – this year’s runner-up alt bets were managed futures and absolute value, epitomized by the WisdomTree Managed Futures Strategy ETF (NYSEARCA: WDTI ) and the HedgeIQ Real Return ETF , respectively. The derby for 2015’s best and worst kicks off today. Stay tuned for ongoing updates.

I Like The Risk Level On SPLV, But I’m Not Entirely Sold

Summary I’m taking a look at SPLV as a candidate for inclusion in my ETF portfolio. I’m not huge on the expense ratio, but I like the other aspects of the ETF. The ETF is incredibly well-diversified which favorably impacts the standard deviation of returns. In the context of Modern Portfolio, the correlation and standard deviation of returns are very important. The ETF looks favorable in those regards. I’m not assessing any tax impacts. Investors should check their own situation for tax exposure. Investors should be seeking to improve their risk adjusted returns. I’m a big fan of using ETFs to achieve the risk adjusted returns relative to the portfolios that a normal investor can generate for themselves after trading costs. I’m working on building a new portfolio, and I’m going to be analyzing several of the ETFs that I am considering for my personal portfolio. One of the funds that I’m considering is the PowerShares S&P 500 Low Volatility Portfolio (NYSEARCA: SPLV ). I’ll be performing a substantial portion of my analysis along the lines of modern portfolio theory, so my goal is to find ways to minimize costs while achieving diversification to reduce my risk level. What does SPLV do? SPLV attempts to track the total return of the S&P 500® Low Volatility Index. At least 90% of funds are invested in companies that are part of the index. SPLV falls under the category of “Large Value.” Does SPLV provide diversification benefits to a portfolio? Each investor may hold a different portfolio, but I use (NYSEARCA: SPY ) as the basis for my analysis. I believe SPY, or another large cap U.S. fund with similar properties, represents the reasonable first step for many investors designing an ETF portfolio. Therefore, I start my diversification analysis by seeing how it works with SPY. I start with an ANOVA table: (click to enlarge) The correlation is about 86%. This is pretty great for making the ETF fit under modern portfolio theory. The low correlation means it should be possible to use the ETF without raising the standard deviation of returns unless the risk ETF has a very high standard of deviation of returns. Standard deviation of daily returns (dividend adjusted, measured since January 2012) The standard deviation is phenomenal. For SPLV it is .5978%. For SPY, it is 0.7300% for the same period. SPY usually beats other ETFs in this regard, so the combination of reasonable correlation and lower standard deviation than SPY is giving this ETF a real chance at being selected for my portfolio. Mixing it with SPY I also run comparisons on the standard deviation of daily returns for the portfolio assuming that the portfolio is combined with the S&P 500. For research, I assume daily rebalancing because it dramatically simplifies the math. With a 50/50 weighting in a portfolio holding only SPY and SPLV, the standard deviation of daily returns across the entire portfolio is 0.6410%. If we drop the position to 20% the standard deviation goes to .6899%. Once we drop it down to a 5% position the standard deviation is .7195%. I haven’t decided what exposure level I would use yet, but probably 5% to 10%. I really like the combination of low volatility and moderate to low correlation. If it wasn’t for the higher expense ratio, I’d consider making this a core holding. Why I use standard deviation of daily returns I don’t believe historical returns have predictive power for future returns, but I do believe historical values for standard deviations of returns relative to other ETFs have some predictive power on future risks and correlations. Yield & Taxes The distribution yield is 2.21%. The yield seems strong enough that it could be included in a retirees portfolio to bring some diversification benefits and a moderate dividend yield. I’m not a CPA or CFP, so I’m not assessing any tax impacts. If I were using SPLV, I would want it to be in a tax exempt account to remove any headaches associated with frequent rebalancing. Expense Ratio The ETF is posting .25% for an expense ratio. I want diversification, I want stability, and I don’t want to pay for them. In my opinion, a .25% expense ratio is higher than I want to pay for equity investments. It’s still low relative to many other methods of investing, but I’m looking for long term holdings and I don’t want to give my investments away. I haven’t decided if it’s worth paying the higher expense ratio to include SPLV. If the expense ratio was under .10%, this ETF would have a very strong case for being included. Market to NAV The ETF is at a .05% premium to NAV currently. In my opinion, that’s not worth worrying about. It is practically trading right on top of NAV. However, premiums or discounts to NAV can change very quickly so investors should check prior to putting in an order. Largest Holdings The portfolio is extremely well diversified. The largest position is around 1.25% of the portfolio. That is solid diversification. The intense diversification is part of the reason the volatility of the ETF is so low. Check out the chart below: (click to enlarge) Conclusion I’m currently screening a large volume of ETFs for my own portfolio. The portfolio I’m building is through Schwab, so I’m able to trade SPLV with no commissions. I have a strong preference for researching ETFs that are free to trade in my account, so most of my research will be on ETFs that fall under the “ETF OneSource” program. SPLV is a difficult ETF to make a decision on. For equity investments, the expense ratio is a bit high, but the relatively low correlation and standard deviation of returns make a pretty good argument for using at least a small position such as 5% in a long term portfolio. I could go either way on this one. I won’t consider it as a core holding (20%+) because of the higher expense ratio. Disclaimer: Information in this article represents the opinion of the analyst. All statements are represented as opinions, rather than facts, and should not be construed as advice to buy or sell a security. Ratings of “outperform” and “underperform” reflect the analyst’s estimation of a divergence between the market value for a security and the price that would be appropriate given the potential for risks and returns relative to other securities. The analyst does not know your particular objectives for returns or constraints upon investing. All investors are encouraged to do their own research before making any investment decision. Information is regularly obtained from Yahoo Finance, Google Finance, and SEC Database. If Yahoo, Google, or the SEC database contained faulty or old information it could be incorporated into my analysis. The analyst holds a diversified portfolio including mutual funds or index funds which may include a small long exposure to the stock.