Tag Archives: power

Policy Easing Puts China ETFs In Focus

Bad economic news continue to flow out of China, with the GDP growth rate falling to 24-year low in 2014, credit crunch concerns, a property market slump, persistently lagging manufacturing sector which contracted for the first time in two years in January 2015. Faltering demand from key export markets like Europe adds to the worries. The issues that plagued the economy in 2012 have actually resurfaced since the start of 2014. To lift the cloud over the economy, the People’s Bank of China (PBOC) surprised the global markets on February 4 with a cut in reserves requirement ratio (RRR) by 50 bps. The latest cut was the first comprehensive one in the Chinese economy after May 2012. Moreover, to boost smaller companies, the PBOC announced an additional RRR cut of 0.5 percentage point for city commercial banks and rural banks. Agricultural Development Bank of China receives a further reduction of 4 percentage points. Australia & New Zealand Banking Group Ltd. economists expect the step to add about 600 billion yuan ($96 billion) to the Chinese banking system. Prior to this, in November, PBOC had slashed one-year lending rate, for the first time in more than two years, by 40 bps to 5.6% and the deposit rate by 25 bps to 2.75%. The PBOC also gave Chinese banks more flexibility in setting the interest rates on deposits in November. Last year, China also took some easing measures including a mini-stimulus package mainly targeted at railways and other construction investment and a tax relief for small enterprises. Moreover, China slashed the RRR for rural banks and focused on innovative rural financial products hinting at the transition to domestic growth from exports. However, all its policy measures were small in scale then and appear not to have contributed significantly to the GDP picture so far. Market Reaction Several market participants expect a few more RRR and interest rate cuts this year with more evidence testifying to the fact that Chinese growth will take time to pick up due to global growth concerns. After all, solid monetary easing becomes essential for China given the sagging inflation which fell to five-year low in November. The sudden move by the People’s Bank of China, which echoes the easy policy era in China in the coming days, offered modest gains in the Chinese stocks. Several Asian markets have benefitted from this decision. In the large cap sphere, the iShares China Large-Cap ETF (NYSEARCA: FXI ) , the iShares MSCI China ETF (NYSEARCA: MCHI ) and the SPDR S&P China ETF (NYSEARCA: GXC ) all added about 1% in the key trading session. The more local China A-Shares ETFs the Deutsche X-trackers Harvest CSI 300 China A-Shares ETF (NYSEARCA: ASHR ) , the Market Vectors ChinaAMC A-Share ETF (NYSEARCA: PEK ) and the PowerShares China A-Share Portfolio ETF (NYSEARCA: CHNA ) have tacked on better gains in the range of 1% to 2.4%. Turnaround Possible in New Year? Those hoping for a turnaround might look forward to the Chinese New Year in late February this year against last year’s late January. This should boost Chinese spending, especially with the greater availability of cash following the latest rate cut. However, over the long run, the situation might moderate. We would like to take a wait and see approach for the broader China ETFs space given a sluggish global economy, though the U.S. demand looks strong. There are a number of headwinds still facing the Chinese economy, including shadow-banking activities and money laundering from mainland China to other peripheral destinations like Macau. A group of economists believe that the government’s excessive focus on anti-corruption activities may in fact hold back GDP growth. Whatever the case, we expect a host of small easing measures now and then from the PBOC as we progress along the year and as the economy comes up with downbeat readings. And whenever this happens, the market should warm up. Chinese equity ETFs are undervalued at the current level with the biggest ETF FXI trading at a P/E (ttm) multiple of 10 against the broader emerging market ETF, the iShares MSCI Emerging Markets ETF (NYSEARCA: EEM ) P/E (ttm) multiple of 12. So investors might have a short-term bet on the aforementioned ETFs to cash in on twin opportunities – the RRR cut and the other New Year spending spree.

Is There A Holy Grail To Investment Success?

It is possible to beat the market averages, otherwise managers like Warren Buffett and George Soros would not have done so consistently for many years. Investors should maximize the geometric mean of their outcomes instead of the arithmetic mean. Leverage destroys the geometric mean of returns over time, which is why it should never be used. The efficient market hypothesis only applies to equity exclusive investors and equity fund managers. Investors who manage concentrated stock portfolios and multiple asset classes can beat the averages. As Dr. Edward Thorp discovered the secret to beating the game of blackjack, investors can use probability to beat the stock market by skewing the odds in their favor. The Holy Grail is described in mythology as the cup that Christ drank from during the Last Supper, and is described as having mystical and miraculous powers. It is the stuff of medieval and Arthurian legend. It is also metaphorically described as something magical and elusive that may or may not exist. For investment professionals, the Holy Grail would be a formula for trading the financial markets that generates superior results. But to determine whether the Holy Grail exists or not we first have to define our terms. What results would classify a trading or investment formula as the Holy Grail? Would it be a strategy that simply beats the stock market averages or beats it by a lot? Some theorists believe there is no investment Holy Grail, just as some believe there is no secret to financial success. But throughout human history there have always been people who succeeded financially and those who did not. Is there a key that separates the successful from the unsuccessful? There must be otherwise it would not be happening, the same way it has happened for thousands of years. The proponents of the Efficient Market Hypothesis (EMH) and Modern Portfolio Theory (MPT) would have you believe that it is not possible to beat the market averages and that everyone should just buy an index fund and be done with it. But if that were true there wouldn’t be managers such as Warren Buffett and George Soros and numerous others who have beaten the averages consistently for many years. If the odds were against them, then they would have lost money or their results would have mirrored the averages. It is obvious they are doing something different from the norm. The question is, what is it? Proponents of EMH argue the averages cannot be bested because they take the performance results of the equity mutual fund industry as a whole and compare it to the market averages. The problem with this reasoning is they fail to make the connection that equity mutual funds as a whole are the market. Of course, their results will not significantly differ from the averages. That is like saying someone who bets on every horse in a race cannot lose. Of course they can’t. After years of experience and extensive research, I’ve come to the conclusion that the Efficient Market Hypothesis, while valid, only applies to equity exclusive investors with broadly diversified stock portfolios. In other words, it applies to individual investors who only buy stocks, as well as equity fund managers. For example, if you are a stock fund manager with a required minimum of 100 stocks in your portfolio, then you will be at a disadvantage. Over time, your results will not significantly differ from the averages, and transaction costs will leave your results below that of the averages. Mathematically speaking, there are two ways to beat the stock market averages: Have a concentrated equity portfolio Own multiple asset classes Leveraging a portfolio will not beat the market averages, as I will explain later. For example, let’s say we have a DeLorean and went back in time to the year 1990. For argument’s sake, let’s say you wanted to invest in equities, but could only buy 5 stocks. You decided to buy Microsoft (NASDAQ: MSFT ), Intel (NASDAQ: INTC ), Apple (NASDAQ: AAPL ), Starbucks (NASDAQ: SBUX ), and Wal-Mart (NYSE: WMT ). How would your portfolio have fared? We all know the answer to that. A portfolio of these winners would have left the market averages in the dust. Of course, hindsight is always 20/20, but this example demonstrates the power of a concentrated portfolio with superior performers. The trouble is, no one could have predicted that result let alone had the wherewithal to stay with those positions. The other way to beat the averages is to own multiple asset classes. Different asset classes, such as bonds, precious metals, real estate, and cash, can not only reduce the overall risk of your portfolio, but also make it more profitable. By holding different asset classes and rebalancing them regularly, investors will be profiting from market fluctuations. This differs from the margin speculator who is betting on the direction of the market. He will always lose in the long run to the balanced investor. The purely mathematical reason for this is because big losses hurt you more than big gains help you. Let’s say you start with $1000 and enter an investment that combines a 9 percent gain with a 9 percent loss. You would end up with $992. In contrast, let’s say a speculator entered the same position, but instead used 10 times the leverage. He would end up with $190 at the end. Roughly an 80 percent net loss! This is astonishing when you think about it, especially given the number of traders out there who are holding naked margin positions. When you ask most speculators about the potential risks of their trading systems, they think simplistically that a 90 percent gain combined with a 90 percent loss will be a wash with no net gain. This is incorrect because they aren’t grasping the concept of the arithmetic versus the geometric mean. With the arithmetic mean or simple average, you add up all the outcomes and divide by the number of outcomes. Whereas, the geometric mean multiplies the outcomes and takes the root of the number of outcomes. For example, let’s take 3 numbers: 1, 7, and 13. The arithmetic mean or simple average would be 7, whereas the geometric mean would be 4.5. (1 + 7 + 13) / 3 = 7 Simple Average ³√ (1 * 7 * 13) = 4.5 Geometric Average The geometric mean is calculated by multiplying the three numbers and taking the cube root of the product. Compound return is geometric average, not simple average. Leverage always lowers the geometric mean of outcomes over time because once again, big losses hurt you more than big gains help you. Every consistently winning manager emphasizes and follows this rule. Large losses destroy a portfolio, and reducing or eliminating leverage is the first step to increasing absolute return. Investors should always choose the game with the highest geometric mean of returns. This is the Holy Grail. However, if you define the Holy Grail as an investment system with all gains and zero losses, not even in the short term, then I would agree there is no Holy Grail. But a system that significantly beats the market averages over time could be classified as such. In 1962, a mathematician by the name of Edward O. Thorp published the book, Beat The Dealer, which presented the first popular mathematical system for beating the game of blackjack. The card counter was born. Contrary to popular opinion, the card counter was not immune to losses. He could lose half his bankroll during a losing streak. But if the counter kept playing, he would beat the casino significantly. It was just a matter of time. The odds were on his side. Dr. Thorp discovered the Holy Grail of beating the game of blackjack. It was a probability puzzle and he figured out how to skew the odds in his favor. The financial markets are nothing more than one giant probability puzzle. If others have beaten it, it is entirely possible that you can too. Disclosure: The author has no positions in any stocks mentioned, and no plans to initiate any positions within the next 72 hours. (More…) The author wrote this article themselves, and it expresses their own opinions. The author is not receiving compensation for it. The author has no business relationship with any company whose stock is mentioned in this article.

El Paso Electric – A Regional Utility Worth Considering

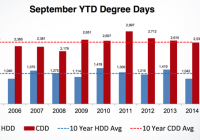
Summary The utilities sector declined nearly 4% on Friday amid strong hiring news. El Paso Electric is now trading at under 18X earnings, cheaper than S&P 500 and Dow Utility Index. After a hiatus beginning in the late-1980s, El Paso Electric is again making dividend payments, including its most recently announced .28/share payment, its 16th straight quarter. Largest market is El Paso in Texas, which is viewed as a pro-business positive net-migration state. Decision not to participate in the renewal of aged coal power-generating plant reflects the modernization and commitment of the Company to provide sustainable long-term energy production. El Paso Electric (NYSE: EE ) is a regional electric utility company that provides generation, transmission, and distribution service to the southwestern United States and Northern Mexico. Its 10,000 square mile service area includes parts of Texas, New Mexico, and two connections to Juarez and the Mexican national utility, Comision Federal de Electricidad. The Company’s principal industrial and large customers operate in the steel production, copper, oil refining and defense industries (including Fort Bliss Army Base and White Sands Missile Range). El Paso Electric’s net dependable generating capability of 1,852 megawatts. Key events and catalysts – A substantial portion of the Company’s fossil fuel generation facilities are over 50 years old. Over the last five years, El Paso Electric has spent nearly $1 billion dollars for the replacement of plant and equipment and for additional generation, transmission and distribution. – El Paso Electric constructed its first new plan in nearly 30 years, a 288 MW Newman 5 natural gas-fired combined cycle plant – Additional cap-ex expected to top $1.5 billion in the next five years – Due to favorable location in high desert and reduction in cost of solar panels, El Paso Electric has introduced significant utility scale solar generation at costs competitive with fossil fuel alternatives – The Company’s Montana Power Station (a $372 million local generation facility) is expected to go on-line by summer of 2015 – El Paso Electric will not participate in extending the operation of the nearly five decade old coal-fired Four Corners Power Generating Station after its scheduled retirement in July 2016. – New Mexico rate case finalization in April 2015 and Texas rate case finalization in August 2015 will seek to recapture costs related to construction, load growth and facility retirement Service Area (Source Annual Report) (click to enlarge) While the population of the state of New Mexico grew a paltry 1.3% from April 2010 – July 2013 (compared the US as a whole – 2.4% – most recent data available from Census Bureau), the state of Texas grew 5.2%, more than double the national rate. Power Generation Station Primary Fuel Type Owned Net Dependable Generating Capacity (NYSE: MW ) Ownership Interest Location Palo Verde Station Nuclear 633 15.8% Wintersburg, Arizona Newman Power Station Natural Gas 732 100% El Paso, Texas Rio Grande Power Station Natural Gas 316 100% Sunland Park, New Mexico Four Corners Station (Units 4&5) Coal 108 7% Fruitland, New Mexico Copper Power Station Natural Gas 62 100% El Paso, Texas Renewables Wind/Solar 1 100% Hudspeth/El Paso Counties, Texas Total   1,852     (Source: Most recent annual report) Notes on power generation: – The Nuclear Regulatory Commission renewed the license of all operating units at Palo Verde which now expire between 2045 – 2047. – The estimated decommissioning costs related to the Palo Verde plant is $381 million. El Paso Electric’s trust fund had a $214 million at 12/31/13. – The 50-year participation agreement among the owners of the Four Corners Station expires in July 2016. El Paso Electric has informed the other owners that it has decided to cease it participation in the plant by July 2016 opting for more economical and cost effect energy alternatives. Customer growth Growth Rate Since 2009 Total growth: 29,335, 1.5% per year Residential growth : 25,482, 1.5% per year (click to enlarge) Customer growth has been positive since 2009, but at a very modest rate in total. Earnings per share EE Net Income (NYSE: TTM ) data by YCharts While earnings per share and net income are generally positive trending over the past decade, El Paso Electric has seen drop-offs in the last several years as decommissioning and other costs have outweighed rate and customer increases. El Paso Electric’s continued profitability hinges on its ability to successfully manage delivery and production costs in a rate-regulated environment. Last Friday, positive hiring news led to declines in “safe-haven” assets including gold, bonds and utilities stocks. El Paso Electric shares fell 4.34%, consistent with sector declines. The Company now trades at 17.72x TTM earnings , which is a lower multiple than the S&P 500 (20.03x) and the Dow Jones Utility Index (19.63x). Reliance on nuclear sourced power   2013 2012 2011 2010 2009 Nuclear 46% 46% 45% 45% 45% Natural Gas 34% 32% 30% 27% 22% Coal 6% 6% 6% 6% 7% Purchased Power 14% 16% 19% 22% 26% Nuclear power makes up a substantial portion of the Company’s sourced electricity. Despite the recoverability of fuel costs for nuclear power generation, it is still expensive and can result in additional regulatory costs associated with production, waste storage and disposal. The Company current sources less than 1% of its power from solar, wind and other renewable sources, but continued investment in these alternative energy sources can help El Paso Electric to remain profitable and competitive. Weather and energy (click to enlarge) (Source: Investor Presentation) Demand for energy is in part driven by climate and weather patterns. As show above, cooling degree days (CDD) dipped below their ten year average for the first time since 2008, while heating degree days (HDD) days are down to levels not seen since 2006. Assuming global warming is real , it is not unreasonable to expect larger and more frequent temperature swings which could drive demand for electricity. Selected Ratio and financial analysis (all information from morningstar.com unless otherwise noted) Ratios and metrics   TTM 2013 2012 2011 2010 2009 Gross margin % 65.6% 67.5% 70.5% 67.5% 66.7% 64.4% Operating margin % 16.3% 18.6% 19.8% 20.8% 19.3% 16.1% Debt/equity 1.12 1.06 1.21 1.07 1.05 1.11 Book value per share 24.13 23.51 20.57 19.10 19.10 16.51 The Company’s gross and operating margins have been fairly consistent, while maintaining a health debt/equity ratio and increasing tangible book value per share. One risk facing the El Paso Electric is the continued availability of debt and equity financing for construction and other projects. Cash flow and dividends   TTM 2013 2012 2011 2010 2009 Operating cash flow 237M 247M 273M 252M 239M 269M Capital expenditures 326M 289M 269M 236M 224M 252M Free cash flow -89M -42M 4M 16M 15M 17M Dividends 1.09 1.05 .97 .66 – – Operating cash flow has been on the decline since 2012, which is not what I look to see from a utility. The Company is investing in business, growing capital expenditures each year since 2010, which hopefully will result in more attractive power generation, distribution, and delivery mechanisms. As previously mentioned, prior to 2011, El Paso Electric had not paid dividends since 1989. Since the reinstitution its dividend policy, the company has grown the total payout each year since 2011. Understanding the Mexico opportunity While El Paso Electric serves a limited geographic (southwestern United States and northern Mexico), it has a fairly diversified customer base within this region. According to El Paso Electric’s most recent annual report, no customer makes up more than 4% of non-fuel base revenues. Most of the energy distributed to the Comision Federal de Electricidad is consumed in Juarez, a city of 1.5 million. While Juarez has a reputation for crime and violence, the city represnts a solid investment opportunity for El Paso Electric as it has nearly doubled in population since 1990. Continued growth and modernization of Juarez will be a long term benefit to El Paso Electric’s bottom line. Leadership El Paso Electric announced Thursday that Chairman of the Board Michael Parks resigned to accept a job with a global investment management firm. Parks served on the board since 1996. He was replaced by long-time board member Charles Yamarone as the new chairman. Bottom line If I was looking for a moderate risk/reward small cap utility play, I would be satisfied owning El Paso Electric at current prices. It has a reasonable 2.8% forward yield , conservative 50% payout ratio, and is taking steps to move away from dirty energy and to cleaner renewable sources. There are a substantial number of utilities that offer higher yield, a longer and more consistent dividend history, and more years of profitability. El Paso Electric may be the right stock for your portfolio, but not the right stock, right now, but if you are on the fence and need a sign, put it on your watch list, and consider scaling into a position when any of the following occur: – Alternative energy as a percentage of net dependable generating capacity exceeds 10% of total. This would mean El Paso Electric has entered a new era of largely clean (natural gas and alternative) energy generation that could be a competitive advantage when the freeze-period expires and competition is introduced into EEs Texas service area. – Yield rises to 5% (but payout stays same or increases). For this to occur, El Paso Electric would need to be trading at $22.40 per share, or a dirt cheap 10.2X earnings. – All Coal and Nuclear operations are ceased and all decommissioning costs settled and final. This would remove substantial uncertainty and potential earnings volatility for intermediate horizon investors (3 – 5 years). Disclosure: The author has no positions in any stocks mentioned, and no plans to initiate any positions within the next 72 hours. (More…) The author wrote this article themselves, and it expresses their own opinions. The author is not receiving compensation for it (other than from Seeking Alpha). The author has no business relationship with any company whose stock is mentioned in this article.