Nasdaq Dividend Achievers: Southern Company
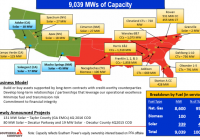
Summary Does Southern Company’s low volatility and high yield make up for its sluggish growth? See Southern Company’s impressive dividend history and competitive advantage analyzed. Southern Company makes a compelling investment case for risk-averse income-oriented investors. Southern Company (NYSE: SO ) is the third-largest publicly traded electric utility based on market cap. The company’s market cap of $40 billion is not far off from the only two larger electric utilities; Dominion Resources (NYSE: D ) with a market cap of $41 billion, and NextEra Energy (NYSE: NEE ) with a market cap of $45 billion. Southern Company supplies electricity to 4.5 million customers in Georgia, Alabama, Mississippi, and Florida. Southern Company is a member of the Dividend Achievers Index. Southern Company has paid steady or increasing dividends since at least 1982. The company has been paying dividends every quarter since 1948; one of the longer active streaks. The Dividend Achievers Index is comprised of businesses with 10 or more consecutive years of dividend payments. You can see the current list of all 238 members of the Dividend Achievers Index here . This article will look at Southern Company’s current events, competitive advantage, and future growth prospects. The company will be examined using The 8 Rules of Dividend Investing . The 8 Rules of Dividend Investing take a systematic approach to building a high quality dividend growth portfolio. Business Overview Southern Company generates 91% of its earnings from heavily regulated traditional utility businesses. The company generates the remaining 9% of earnings from its competitive wholesale electric business. Southern Company’s operations consist of the following subsidiaries and affiliates: Alabama Power Georgia Power Gulf Power Mississippi Power Southern Power Southern Nuclear SouthernLINC Wireless The company generates electricity through a variety of assets located throughout the South East, South, and South West United States. The image below shows the company’s electricity generating assets. (click to enlarge) Source: Southern Company March 2015 Business Overview Presentation Competitive Advantage Southern Company’s competitive advantage comes from its monopoly electricity provider status in the markets it serves. Electric utilities are natural monopolies due to the high cost of building power plants and the impracticality of moving your entire life because you don’t like your electricity provider. Southern Company is one of the largest publicly traded electricity companies. It has a long history of growth thanks to population growth and the controlled and highly regulated utilities market in the United States. The company’s strong competitive advantage virtually ensures slow and steady growth for years to come. Current Events & Growth Prospects Southern Company has experienced 2 recent setbacks. The company is building a coal gasification plant in Mississippi. The plant was originally expected to go online in May of 2014. Due to ongoing construction delays, the plant is now expected to go online during the first half of 2016. This 2-year delay has already cost Southern Company over $1 billion. The second setback for Southern Company is the ongoing delays in the two Vogtle nuclear plants. The contractor building the plants has stated that the construction completion date has been delayed by 18 months for each plant. Every month of delay will cost Southern Company an extra $40 million. The full 18-month delay is expected to cost over $700 million. Despite these setbacks, Southern Company is projected to grow earnings per share between 3% and 4% a year in 2015. This is a reasonable long-term earnings per share growth rate for the company. The GDP in the area is expected to grow at 3% in 2015, and Southern Company should match or slightly exceed this growth. As with most utilities, investors should not expect rapid growth from Southern Company. Total return should be between 7.7% and 8.7% from growth (3% to 4%) and dividends (4.7%). Recession Performance As one would expect from an electric utility, Southern Company’s operations were largely unaffected by the Great Recession of 2007 to 2009. The company’s earnings per share through the Great Recession and subsequent recovery are shown below to drive home this point: 2007: EPS of $2.28 2008: EPS of $2.25 2009: EPS of $2.32 2010: EPS of $2.36 2011: EPS of $2.55 The 8 Rules of Dividend Investing The sections below will compare Southern Company to other businesses with a long history of dividend increases using the 5 Buy Rules from The 8 Rules of Dividend Investing . Each rule has a short “why it matters” section, explaining why the rule is relevant. Rule 1: 25+ Years of Dividends Without A Reduction Southern Company has paid steady or increasing dividends since at least 1982 (when Yahoo Finance dividend data first starts). The company has paid regular dividends since 1948 and easily passes the first rule of dividend investing. Why it matters: The Dividend Aristocrats (stocks with 25+ years of rising dividends) have outperformed the S&P 500 over the last 10 years by 2.88 percentage points per year. Source: S&P 500 Dividend Aristocrats Factsheet Rule 2: Dividend Yield Southern Company has an extremely high dividend yield of 4.7%. The company has the eighth-highest dividend yield out of 156 stocks with 25+ years of dividend payments without a reduction. Southern Company’s high dividend yield should be especially appealing to income-oriented investors. Why it Matters: Stocks with higher dividend yields have historically outperformed stocks with lower dividend yields. The highest-yielding quintile of stocks outperformed the lowest-yielding quintile by 1.76 percentage points per year from 1928 to 2013. Source: Dividends: A Review of Historical Returns Rule 3: Payout Ratio Using adjusted earnings, Southern Company has a high payout ratio of 75%. The company’s extremely stable cash flows mitigate the risk of Southern Company reducing its dividend payments, however. Still, investors should not expect dividend growth ahead of earnings-per-share growth due to the company’s high payout ratio. Southern Company has the 144th lowest payout ratio out of 156 stocks with long dividend histories. Why it Matters: High-yield, low-payout ratio stocks outperformed high-yield, high-payout ratio stocks by 8.2 percentage points per year from 1990 to 2006. Source: High Yield, Low Payout by Barefoot, Patel, & Yao, page 3 Rule 4: Long-Term Growth Rate Southern Company has grown its dividend payments at 6.9% a year over the last decade. This growth will slow going forward. Management is projecting a target of 3% to 4% earnings-per-share growth going forward. As discussed in the growth section above, this number is a fair growth estimate for the company. With an expected growth rate of 3.5%, Southern Company has the 102nd highest growth rate out of 156 stocks with 25+ years of dividend payments without a reduction. Why it Matters: Growing dividend stocks have outperformed stocks with unchanging dividends by 2.4 percentage points per year from 1972 to 2013. Source: Rising Dividends Fund, Oppenheimer, page 4 Rule 5: Long-Term Volatility Southern Company has an exceptionally low stock price standard deviation of just 16.85%. This is the third-lowest in the entire Sure Dividend database, behind only Consolidated Edison (NYSE: ED ) and Johnson & Johnson (NYSE: JNJ ). Southern Company’s extremely low stock price volatility should appeal to risk-averse investors. Why it Matters: The S&P Low Volatility index outperformed the S&P 500 by 2 percentage points per year for the 20-year period ending September 30, 2011. Source: Low & Slow Could Win the Race Final Thoughts With an expected total return of around 8.2% from dividends (4.7%) and growth (3.5%), Southern Company offers investors decent total return potential. The company shines with its extremely low stock price volatility. Southern Company’s combination of high yield and low volatility carries it into the top 20% of stocks using The 8 Rules of Dividend Investing . The company should appeal to investors looking for low risk, high income, and slow but steady growth. Disclosure: The author has no positions in any stocks mentioned, and no plans to initiate any positions within the next 72 hours. (More…) The author wrote this article themselves, and it expresses their own opinions. The author is not receiving compensation for it (other than from Seeking Alpha). The author has no business relationship with any company whose stock is mentioned in this article.