Tag Archives: portfolio

Hawaiian Electric Industries (HE) Q4 2014 Results – Earnings Call Webcast

The following audio is from a conference call that will begin on February 12, 2015 at 17:00 PM ET. The audio will stream live while the call is active, and can be replayed upon its completion. Are you Bullish or Bearish on ? Bullish Bearish Neutral Results for ( ) Thanks for sharing your thoughts. Submit & View Results Skip to results » Share this article with a colleague

IHD: A Tough Sell Based On Performance

Summary IHD invests in emerging markets, which has been a tough market of late. That said, it offers investors a large yield. The problem is the yield is eating away at the CEF’s NAV. The Voya Emerging Markets High Dividend Equity Fund (NYSE: IHD ) is an interesting closed-end fund, or CEF, for those seeking an emerging market play. Essentially, it allows you to add a high-yield investment ( around 11% ) in emerging markets, a key asset allocation basket, to your portfolio. That’s not easy to find. For example, The Vanguard Emerging Markets Stock Index Fund (MUTF: VEIEX ) is yielding around 2.65% based on trailing distributions. But, IHD’s income comes at a cost you may not be willing to pay. What it does IHD’s objective is total return from a mixture of dividends, capital gains, and capital appreciation. It invests, as its name suggests, in emerging market equities. Typically, the portfolio will hold between 60 and 120 securities. On top of that, IHD will sell options on as much as 50% of the portfolio’s value. The options can be on individual stocks but also on indexes and exchange traded funds. Presumably that’s to increase the opportunities for option writing since options on some holdings may not exist or be liquid enough to trade. When looking for stocks, IHD starts with filters based on dividend yield and liquidity to create a universe from which to select individual holdings. It then takes the top-ranked stocks from this list and does fundamental research, evaluating such things as dividend sustainability and growth potential. At the end of the day, IHD is looking to create a portfolio of attractively valued companies with sustainable dividend yields and the potential for growth. The fund’s expenses aren’t outlandish at around 1.4%, according to the Closed-End Fund Association. The fund is, after all, providing active management in areas of the world that are often difficult to invest in, let alone find information about. You probably couldn’t do what they do, even if you wanted to. And that’s before trying to sell options. What about performance So far so good, but… the fund’s performance is middling at best. According to Morningstar, IHD’s trailing three-year annualized net asset value, or NAV, return through January of -1.3% falls at about the 65th percentile of its diversified emerging markets category grouping. Note that Morningstar’s figures include the reinvestment of dividends. The broader category effectively broke even over that span and Vanguard Emerging Market Index Fund posted an annualized gain of roughly 0.75%. So, IHD’s performance is a little below par, but a fat 11% yield might entice you to overlook this fact. That would likely be a mistake here. When IHD came public in early 2011, its NAV was $19.06 a share. The CEF’s NAV fell consistently through February of last year (its fiscal years end in February), bringing the NAV down to $12.50 a share. Sure it paid distributions of around $4 a share over that time, but the NAV decline was precipitous. The NAV is currently around $11.50 a share, which means it’s still going down. You’ll need a rally To be fair, emerging markets haven’t been the most hospitable place to invest in recent years. But this is clearly a case where the large dividend is doing a disservice to shareholders. That’s particularly true if you are using those distributions to live off of. Worse, you’d still be losing money even if you reinvested those distributions. I could go into the fund’s discount (roughly 8%, notably below the fund’s three-year average of about 3%), its country allocations (China is its largest weighting at 20% of assets), sector allocations (finance is around 30% of the portfolio), and individual holdings, but at this point all of that pales in comparison to the distribution’s impact on NAV. Even the chance of the discount closing isn’t particularly enticing in my book compared to the NAV issue. I would avoid IHD unless you think emerging markets are on the verge of a major bull market. That’s the only way you’ll likely see the NAV turn higher. Disclosure: The author has no positions in any stocks mentioned, and no plans to initiate any positions within the next 72 hours. (More…) The author wrote this article themselves, and it expresses their own opinions. The author is not receiving compensation for it (other than from Seeking Alpha). The author has no business relationship with any company whose stock is mentioned in this article.
Investing For Retirement Using Schwab Mutual Funds

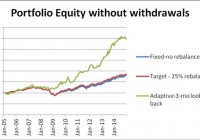
Summary Schwab offers a set of diversified mutual funds which can be successfully used for construction of investment portfolios with good withdrawal rates. A set of just three mutual funds, a bond, a large cap dividend equity growth, plus a small cap fund generates good returns with relatively low risk. From January 2005 to January 2015, a Schwab portfolio with fixed allocation could produce a safe 5% annual without any substantial decrease of the capital. Same portfolio with rebalancing at 25% deviation from the target allowed a safe 5% annual withdrawal rate with a smaller decrease of the capital. Same portfolio with momentum-based adaptive allocation could have produced a safe 10% annual withdrawal rate and 0.52% annual increase of the capital. This article belongs to a series of articles dedicated for investing in various mutual fund families. In previous articles we reported our research on Fidelity, Vanguard, T Rowe Price, and American Century mutual fund families. The current article does the same for Schwab family of mutual funds. The series of these articles is aimed at a broad spectrum of investors. They may be useful to small individual investors as well as to any large institution managing retirement accounts. The general methodology we use in selecting the funds for the portfolio was presented in a previous article. The portfolio includes three funds: one bond fund and two equity funds. The equity funds are complementary: one covers large capitalization stocks paying high dividends, the other fund contains small capitalization growth stocks. Historically, the selected funds have performed better than most other funds in their category. The mutual funds been selected for investment are the following: Schwab total bond market fund (MUTF: SWLBX ) Schwab Dividend Equity fund (MUTF: SWSCX ) Schwab Small Cap Equity fund (MUTF: SWDSX ) As in the previous articles, three different strategies are considered: (1) Fixed asset allocation. The portfolio is initially invested 50% in the bond fund and 50% equally divided between the two stock funds, without rebalancing. (2) Target asset allocation with rebalancing. The portfolio is initially invested 50% in the bond fund and 50% equally divided between the two stock funds and is rebalanced when the allocation to any fund deviates by 25% from its target. (3) Momentum-based adaptive asset allocation. The portfolio is at all times invested 100% in only one fund. The switching, if necessary, is done monthly at closing of the last trading day of the month. All money is invested in the fund with the highest return over the previous 3 months. The data for the study were downloaded from Yahoo Finance on the Historical Prices menu for three tickers: SWLBX, SWSCX, and SWDSX. We use the monthly price data from January 2005 to January 2015, adjusted for dividend payments. The paper is made up of two parts. In part I, we examine the performance of portfolios without any income withdrawal. In part II, we examine the performance of portfolios when income is extracted periodically from the accounts. Part I: Portfolios without withdrawals We report the performance of the portfolios under two scenarios: (1) no withdrawals are made during the time interval of the study, and (2) withdrawals at a fixed rate of the initial investment are made periodically. In table 1 we show the results of the portfolios managed for 10 years, from January 2005 to January 2015. Table 1. Portfolios without withdrawals 2005 – 2015. Strategy Total increase% CAGR% Number trades MaxDD% Fixed-no rebalance 79.75 5.98 0 -31.09 Target-25% rebalance 86.22 6.36 3 -31.09 Momentum-Adaptive 247.20 13.25 36 -14.74 The time evolution of the equity in the portfolios is shown in Figure 1. (click to enlarge) Figure 1. Equities of portfolios without withdrawals. Source: This chart is based on EXCEL calculations using the adjusted monthly closing share prices of securities. From figure 1 it is apparent that the rate of increase of the adaptive portfolio is substantially greater than the rate of the fixed and target allocation portfolios. Part II: Portfolios with withdrawals Assume that we invest $1,000,000 for income in retirement. We plan to withdraw monthly a fixed percentage of the initial investment. That amount is increased by 2% annually in order to account for inflation. In table 2 we show the results of the portfolios managed for 10 years, from January 2005 to January 2015. Money was withdrawn monthly at a 5% annual rate of the initial investment plus a 2% inflation adjustment. Over the 10 years from January 2005 to January 2015, a total of $535,920 was withdrawn. Table 2. Portfolios with 5% annual withdrawal rate 2005 – 2015. Strategy Total increase% CAGR% Number trades MaxDD% Fixed-no rebalance -0.21 -0.02 0 -36.32 Target-25% rebalance -0.01 -0.00 3 -37.39 Momentum-Adaptive 126.32 8.51 36 -20.50 The time evolution of the equity in the portfolios is shown in Figure 2. (click to enlarge) Figure 2. Equities of portfolios with 5% annual withdrawal rates. Source: This chart is based on EXCEL calculations using the adjusted monthly closing share prices of securities. To illustrate the advantage of the adaptive allocation strategy and the effect of withdrawal rates on the evolution of the capital, we give in Table 3 the results of simulations for the following withdrawal rates: 0%, 5%, 10%, and 12%. Table 3. Adaptive Portfolios with various annual withdrawal rates 2005 – 2015. Withdrawal rate % Total increase% CAGR% MaxDD% 0 247.20 13.25 -14.74 5 126.32 8.51 -20.50 8 53.77 4.40 -25.64 10 5.40 0.52 -30.04 The time evolution of the equity in the portfolios is shown in Figure 3. (click to enlarge) Figure 3. Equities of momentum-based portfolios with various annual withdrawal rates. Source: This chart is based on EXCEL calculations using the adjusted monthly closing share prices of securities. Conclusion The set of three Schwab mutual funds, selected for this study, perform well for all three strategies and generate sustainable returns at relatively low drawdowns. Between 2005 and 2015, the fixed target allocation with rebalancing was able to sustain withdrawal rates of up to 5% annually. The adaptive allocation algorithm was able to sustain withdrawal rates up to 10% annually without any decrease of capital. Additional disclosure: This article is the fifth in a sequence on investing in mutual funds for retirement accounts. To help the reader compare the past performance of various mutual fund families, I selected a benchmark 10-year time interval starting on 1 January 2005 and ending on 31 December 2014. The article was written for educational purposes and should not be considered as specific investment advice. Disclosure: The author has no positions in any stocks mentioned, and no plans to initiate any positions within the next 72 hours. (More…) The author wrote this article themselves, and it expresses their own opinions. The author is not receiving compensation for it (other than from Seeking Alpha). The author has no business relationship with any company whose stock is mentioned in this article.