Risky Business? Rethinking International Equity Allocations
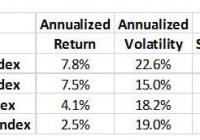
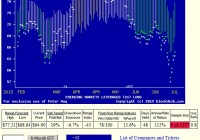
Summary Lower risk outcomes have been achieved by adding, rather than excluding, EM and FM in a global portfolio. The inclusion of EM and FM equities has reduced inter-asset correlation considerably, improving diversification. Investors have been better off allocating to EM than to EAFE for the past 15 years —despite EM’s higher risk profile. We believe investors should allocate 50% of their non-U.S. equity exposure to EM. When approaching asset allocation, equity investors often follow a top-down, macro-economic approach to consider the merits of each country or region in their portfolio before considering the characteristics of individual securities. These allocations are generally made among the U.S., EAFE (Europe, Australasia and Far East), EM (Emerging Markets) and FM (Frontier Markets). We have noticed that many investors focus on riskiness or volatility of an asset class at the expense of the overall risk-adjusted returns or how different investments work together in a portfolio. With this in mind, we examined the optimal equity allocations and found that some of the historically most volatile asset classes have effectively lowered portfolio risk when properly combined. The inclusion of EM and FM equities has reduced inter-asset correlation considerably and improved diversification. In fact, an allocation to EAFE provided no portfolio benefit-decreasing portfolio returns and increasing risk-while even a modest allocation to EM and FM increased overall portfolio risk-adjusted returns. Investors need to be more comfortable with strategically reallocating within their international investments in order to better exploit the growth and diversification opportunities that exist. Specifically, we believe investors should split their non-U.S. equity portfolio equally between EM and EAFE. EM and FM equities offer the highest risk-adjusted returns We used a mean-variance framework to examine equity portfolio allocations historically, specifically considering returns against a standard measure of risk (volatility). We calculated return and volatility data for the S&P 500 Index (U.S.), the MSCI EAFE Index (EAFE), the MSCI EM Index (NYSE: EM ) and the MSCI Frontier Markets Index (NYSEARCA: FM ) since 2000 (Figure 1). 1 Figure 1 – Index performance 12/31/1999 – 5/29/2015 Source: Bloomberg; MSCI; EGA. Weekly data as of 5/29/2015. Note: Calculation for the MSCI FM Index starts from 5/31/2002. Past performance does not guarantee future results. Assets are combined in different proportions to obtain different portfolios of risk-adjusted returns. When all portfolios generated from the data in Figure 1 are plotted on a chart, they form an efficient frontier (the dark blue line on Figure 2). The left-most point of this curve is the minimum variance portfolio-the point at which portfolio volatility (and in this case, return) is minimized. For comparison, we also illustrate an efficient frontier consisting only of U.S. and EAFE equities (the gray line on Figure 2). Based on the results of the efficient frontier that includes all equity asset classes, investors who put primary importance on volatility are likely to prefer a global portfolio dominated by U.S. exposure, whereas investors seeking to maximize their risk efficiency would likely prefer allocations with increasing exposures to EM and FM equities. Note that the early inclusion of EM equities in the minimum variance portfolio, dominated by U.S. equities, leads to a meaningful increase in returns, yet only a small increase in risk; the highest risk-adjusted portfolio (the portfolio with the maximum Sharpe Ratio) consisted of 75% EM and 25% FM, whereas U.S. and EAFE equities did not merit any allocation at all. Two important conclusions arise from a direct comparison of the two efficient frontiers. First, lower relative levels of risk and superior performance can be achieved through the addition of EM and FM to global allocations, highlighting their diversification benefits as well as their ability to enhance returns. Second, a wider spectrum of portfolio risk/return efficiency can be achieved with the use of EM and FM. Overall, a portfolio of solely EM and FM equities offers the highest risk-adjusted returns. When these asset classes are combined with U.S. and EAFE assets, risk is further reduced and returns further enhanced. To understand why this is the case, we explore risk and return in further detail. Figure 2 – Efficient Frontiers 12/31/1999 – 5/29/2015 (click to enlarge) Source: Bloomberg; MSCI; EGA. Weekly data as of 5/29/2015. Note: Calculation for the MSCI FM Index starts from 5/31/2002. Risk (or Volatility) is annualized standard deviation based on weekly returns from 12/31/1999, except for the MSCI FM Index where the data start from 5/31/2002. Allocations may not add to 100% due to rounding. Past performance does not guarantee future results. Risk assessment: EM equities exhibit the highest volatility… In examining risk, we look at the volatility of returns for each region through various time periods . In general, variability of returns is highest in EM equities, followed by EAFE, then the U.S. and finally, FM. In our opinion, FM equities have the lowest variability of returns because they exhibit low foreign ownership as well as tend to be less influenced by global factors and more by idiosyncratic local factors. These factors help explain the relatively low levels of volatility displayed by FM. Figure 3 – Annualized Volatility (click to enlarge) Source: Bloomberg; MSCI; EGA. Weekly data as of 5/29/2015. Past performance does not guarantee future results. …but lower correlations drive portfolio efficiency Investors, however, would be better served to concern themselves with portfolio-level volatility, rather than that of its component assets. Avoiding specific asset classes because of their individual volatility profile disregards key tenets of portfolio construction: it is how the assets work together in the aggregate that matters most. Some of the most historically volatile asset classes have effectively lowered portfolio risk when properly combined. This is illustrated with the inclusion of EM in Figure 2-EM has relatively higher levels of volatility (Figure 3) as well as lower levels of correlation to the U.S. (Figure 4), but the addition of EM has actually lowered portfolio volatility in some allocations. The same can be observed in FM, although its level of volatility is even lower than that of the U.S. for reasons previously stated. Essentially, EAFE’s high volatility and high correlation to the U.S. make it a less effective source of diversification. Figure 4 – Asset Class Correlations 5/31/2002 – 5/29/2015 (click to enlarge) Source: Bloomberg; MSCI; EGA. Weekly data as of 5/29/2015. Past performance does not guarantee future results. The inclusion of EM and FM equities has consistentlyreduced inter-asset correlation considerably, thereby improving diversification . At the portfolio level, investors have been better off allocating to EM than to EAFE for the past 15 years – despite EM’s higher risk profile. Figure 5 – EM and FM consistently improve diversification more than EAFE 5/30/2003 – 5/29/2015 Source: Bloomberg; MSCI; EGA. Weekly data as of 5/29/2015. Past performance does not guarantee future results. EM and FM lower projected risk in a global portfolio Capital market assumptions are generally constructed with future returns in mind. While EGA does not forecast returns, we use the Gordon Growth Model to approximate how investors currently value future returns. This model assumes that the cost of equity (as measured by earnings yield) is an adequate proxy for long-term expected equity returns. To account for that volatility, we used 15-year historical volatility. We believe that this time frame is most appropriate given central banks’ Quantitative Easing (QE) programs have artificially dampened the volatility of asset returns worldwide. Furthermore, a normalization of central bank policies, as is underway in the U.S., should also lead to a reversion to historical levels of volatility. (See for the inputs used in the model.) FM equities are capped at the weight of a third of EM as they were in the initial mean-variance analysis . Figure 6 – Inputs for Efficient Frontiers (ex-ante) Source: Bloomberg; FactSet; MSCI; EGA. Target Return Data as of 5/29/2015, Volatility Data as of 5/29/2015 (weekly). Note: Target return is calculated as the reciprocal of the harmonic mean of trailing P/E and forward P/E. Volatility is annualized standard deviation based on weekly returns from 12/31/1999 except for the MSCI FM Index where the data start from 5/31/2002. Risk-free rate used is the weekly average of the U.S. generic government 3-month yield from 12/31/1999. Past performance does not guarantee future results. Using the expected returns and volatility presented in , the shape of the ex-ante portfolio efficient frontier in Figure 7 remains unchanged from that shown in figure 2. Once again, we observe that higher portfolio returns can be attained by including EM and FM in global allocations. Investors can achieve the maximum risk/return efficiency (Sharpe Ratio) with 75% of their equity exposure in EM and 25% in FM; notice that U.S. and EAFE equities are zero weight as was the case in Figure 2. Lower risk outcomes are achieved by adding, rather than excluding, EM and FM into the equity portfolio. The inclusion of EAFE only serves to worsen the risk-reward outcome and is therefore it is absent from most of the efficient frontier. Today certain factors and market conditions favor EM. We believe that EM currencies in aggregate are near all-time lows and that valuations are much lower for EM/FM than they are for the other developed market equity indices. It is unlikely that these two factors, which have weakened EM total returns in the past five years should continue to cause further material underperformance. Figure 7 – Efficient Frontiers (ex-ante) (click to enlarge) Source: Bloomberg; FactSet; MSCI; EGA. Weekly data as of 5/29/2015. Risk (or Volatility) is annualized standard deviation based on weekly returns from 12/31/1999, except for the MSCI FM Index where the data start from 5/31/2002. Risk-free rate used is the weekly average of the U.S. Allocations may not add to 100% due to rounding. Optimizing Allocations: Investing in EM and FM equities to diversify a U.S. equity portfolio From a portfolio construction perspective, our quantitative optimization process revealed that the maximum Sharpe Ratio portfolio consists only of 75% EM and 25% FM (Figure 7). Despite its volatility profile, EM provides investors with a highly risk-efficient diversification benefit. Correlations matter just as much as volatility and returns when constructing portfolios. Taking this into consideration, the portfolio effect exceeds the risk/return efficiency of any single asset class shown, demonstrating the science behind asset allocation. While the math demonstrates the value of a portfolio with only EM and FM equity allocations, we recognize this is not reasonable for most U.S. investors who will likely have a portfolio anchored in U.S. equities that includes some portion of EAFE equities. However, we believe that investors seeking greater returns efficiency will appreciate the importance of properly allocating to lower correlated asset classes, including EM and FM. With this in mind, the light blue line in Figure 7 offers an alternative equity allocation strategy that splits the non-U.S. exposure equally between EAFE and EM . Although the amount allocated to EAFE/EM would vary according to investors’ preferences to U.S., the proportion of EM to EAFE does not. The net effect of this EAFE/EM equalization strategy is greater portfolio efficiency than those portfolios that would exclude EM altogether. Conclusion This commentary illustrates how EM can improve portfolio efficiency. Apart from this, we recognize that many see attractive investment opportunities within EM. The potential tailwind of fundamental inputs can help provide a backdrop of confidence for portfolio arguments. While EAFE equities have risen on expectations of a successful QE program and U.S. equities have appreciated on expectations of further earnings growth, EM equities have not participated in a sustained post-financial crisis global equity rally. We believe there is scope for EM valuations to return to a more normal relationship to developed markets. This expected valuation convergence gives us conviction today that investors should increasingly look to EM for potential growth opportunities and/or diversification away from developed markets. EM currencies are similarly at relatively low levels versus the dollar, even though EM sovereign balance sheets and fiscal health tend to be favorable versus developed markets. Lastly, EM is a critical part of the world economy, accounting for nearly 40% of global GDP and matching the GDP contribution of EAFE, but with over twice the growth rate. 2 Against this backdrop, we have illustrated how EM and FM can improve global equity portfolios. The inclusion of EM and FM equities reduces inter-asset correlation considerably and improves portfolio diversification. Lower risk outcomes are achieved by adding, rather than excluding, EM and FM in a global portfolio and investors have been better off allocating to EM than to EAFE for the past 15 years-despite EM’s higher risk profile. We believe investors should evenly split their non-U.S. equity exposure and allocate 50% of it to EM and 50% to EAFE. Those investors comfortable allocating to FM can incorporate an allocation into the EM sleeve of their portfolios as well. Footnotes 1 Throughout this paper, all references to U.S., EAFE, EM and FM performance and allocation are in reference to these benchmark indices. 2 Source: IMF-World Economic Outlook, October 2014. Definitions Gross Domestic Product (NYSE: GDP ) is a money measure of the goods and services produced within a country’s borders over a stated time period. MSCI Emerging Markets Index ( EM ) is an index that is designed to measure equity market performance in global emerging markets. MSCI Europe, Australasia, Far East (EAFE) Index is an index covering developed market countries in Europe, Australasia, Israel and the Far East. MSCI Frontier Markets Index is an index that captures large and mid cap representation across 24 Frontier Markets countries. S&P 500 Index is an index that is a broad-based measure of U.S. stock market performance. Sharpe Ratio is a risk-adjusted measure of return that calculates the average return in excess of the risk-free rate divided by the standard deviation of return; a measure of the average excess return earned per unit of standard deviation of return. Standard Deviation is a measure of volatility, or risk, which is the square root of the variance; a measure of dispersion in the same units as the original data. Disclosures and Risks Investors should carefully consider the investment objectives, risks, charges and expenses of a Fund before investing. To obtain a prospectus for any EGA or EGShares Funds and other important information, as well as to obtain most recent index performance, please call +1 888 800 4347 or visit emergingglobaladvisors.com to view or download a prospectus. Read the prospectus carefully before investing. Emerging market investments involve risk of capital loss from unfavorable fluctuation in currency values, from differences in generally accepted accounting principles, from economic or political instability in other nations or increased volatility and lower trading volume. Small and mid-cap companies generally will have greater volatility in price than the stocks of large companies due to limited product lines or resources, or a dependency upon a particular market niche. Index returns are for illustrative purposes only and do not represent actual fund performance. Index performance returns do not reflect any management fees, transaction costs or expenses, which could reduce returns. Indexes are unmanaged and one cannot invest directly in an index. The MSCI information may only be used for your internal use, may not be reproduced or disseminated in any form and may not be used as a basis for or a component of any financial instruments or products or indices. None of the MSCI information is intended to constitute investment advice or a recommendation to make (or refrain from making) any kind of investment decision and may not be relied on as such. Historical data and analysis should not be taken as an indication or guarantee of any future performance analysis, forecast or prediction. The MSCI information is provided on an “as is” basis and the user of this information assumes the entire risk of any use made of this information. MSCI, each of its affiliates and each other person involved in or related to compiling, computing or creating any MSCI information (collectively, the “MSCI Parties”) expressly disclaims all warranties (including, without limitation, any warranties of originality, accuracy, completeness, timeliness, non-infringement, merchantability and fitness for a particular purpose) with respect to this information. Without limiting any of the foregoing, in no event shall any MSCI Party have any liability for any direct, indirect, special, incidental, punitive, consequential (including, without limitation, lost profits) or any other damages. The content of this presentation is presented for general information purposes only. Nothing contained herein should be considered a recommendation or advice to purchase or sell any security. While the information and statistical data contained herein are based on sources believed to be reliable, we do not represent that it is accurate and it should not be relied on as such or be the basis for an investment decision. The statements and opinions expressed are those of Emerging Global Advisors, LLC and are as of the date of this presentation. All information is historical and not indicative of future results, and subject to change. This presentation may include estimates, projections and other “forward-looking statements. Due to numerous factors, actual events may differ substantially from those presented. Emerging Global Advisors, LLC assumes no duty to update any such statements. Past performance is no guarantee of future results. ETF shares are bought and sold at market price (not NAV) and are not individually redeemed from the Fund. EGShares Funds (“Funds”) are distributed by ALPS Distributors, Inc. ALPS and Emerging Global Advisors are unaffiliated entities. ©2015 Emerging Global Advisors, LLC. All rights reserved. EGA®, EGSharesSM and EGAISM are service marks of Emerging Global Advisors, LLC. All other trademarks, service marks or registered trademarks are the property of their respective owners. EGS002450 | Expires 7/1/2016 Disclosure: I/we have no positions in any stocks mentioned, and no plans to initiate any positions within the next 72 hours. (More…) I wrote this article myself, and it expresses my own opinions. I am not receiving compensation for it. I have no business relationship with any company whose stock is mentioned in this article.