Tag Archives: nasdaq

Buy-Ranked Gaming ETF In Focus
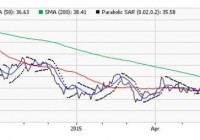
The once-thriving global gaming industry was badly hit by the slowdown in the Chinese economy that led to sluggish casino business in Macau – the world’s largest casino gaming destination. This is because the nationwide crackdown on corruption in China last year compelled Macau officials to impose restrictions on illegal money transfers in VIP gambling from mainland China to Macau. This has taken a toll on overall gambling revenues hurting the casino stocks at large. Additionally, smoking ban in casinos, tighter restrictions on visas and lower spending by high-stake gamblers added to the woes (read: 4 China A-Shares ETFs Pick Up After Gloom ). This 16-month bear trend now seems to be reversing with many casino stocks bouncing up from their lower levels. In particular, the U.S. casino giants like Las Vegas Sands (NYSE: LVS ), Wynn Resorts (NASDAQ: WYNN ), Melco Crown Entertainment Limited (NASDAQ: MPEL ) and MGM Resorts International (NYSE: MGM ) are up 4.5%, 2.6%, 5.5% and 1.5%, respectively, since the start of the second quarter. Hong Kong listed Galaxy Entertainment Group ( OTCPK:GXYEY ) added 5.6% while Sands China ( OTCPK:SCHYY ) moved higher by 15.1% so far this month. The impressive gains were brought in by the easing of tourist restrictions in Macau, and the possibility that bans on gaming-floor smoking rooms will be eased once operators maintain decorum and protect these rooms from harmful tobacco smoke. Effective July 1, mainland China passport holders transiting through Macau can stay there for two days longer and could gain entry into the city within 30 days instead of 60 days previously. This move will benefit casino operators in the months ahead. Further, the Chinese economy is stabilizing and casino operators in Macau are making efforts to diversify their businesses beyond gaming for additional revenue streams (read: ETFs to Play 3 Undervalued Sectors ). Apart from these, casino stocks seem extremely cheap at the current levels as the average valuation on Macau’s five biggest casino operators by market value has dropped to 18 times estimated earnings , about half of the peak reached in December 2013. This suggests an attractive point to enter the gaming market. Given this, investors could play this space with lower risk in a basket form rather than tilting toward individual companies. The Market Vectors Gaming ETF (NYSEARCA: BJK ) is the lone ETF providing investors global exposure to the casino gaming market. The fund has a Zacks ETF Rank of 2 or “Buy” rating with a High risk outlook (see: all the Top Ranked ETFs ). BJK in Focus This product follows the Market Vectors Global Gaming Index, holding 47 securities in its basket. It is concentrated on the top 10 holdings with the largest allocation going to Las Vegas, Galaxy Entertainment and Wynn Resorts that have combined to make up for 22.6% share. In terms of country exposure, U.S. takes the top spot at 36.8%, followed by China and Australia with 13% share each. The fund focuses on large caps at 56.2% while mid caps account for the remainder. From a style look, it has a nice mix of blend, value and growth securities, reflecting superior weightings. However, investors often overlook the fund as it has accumulated only $29.6 million in its asset base and trades in small volume of roughly 12,000 shares per day. This ensures additional cost in the form of wide bid/ask spread beyond the expense ratio of 0.65%, which is already at the higher end of the expense ratios prevailing in consumer discretionary ETF space. In terms of performance, BJK has been lagging the broad market and lost 24.2% in the trailing one-year period and 5.1% so far this year. But it recently broken its near-term range as depicted by the chart below, indicating some smooth trading in the weeks ahead. The fund’s short-term moving average (9-Day SMA) has managed to move ahead of the mid-term moving average (50-Day SMA) and is now treading toward the long-term (200-Day SMA) average, signaling upside for the fund. Further, the bullish trend is confirmed by the parabolic SAR, which is currently trading below the current price of the fund. Bottom Line Given the bullish technical indicators and improving fundamentals in Macau, investors could garner huge profits in the gaming industry with this top ranked ETF. Original post
A Comparison: Six Inverse Treasury Products

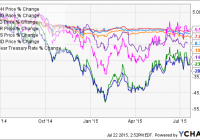
Summary With the possibility of an interest rate hike, investors should consider options for inverse leverage. I chose a basket of six comparable securities with varying degrees of inverse exposure to analyze. High yield bond and short treasury future combo ETFs are an interesting way to hedge against a potential rate hike. Introduction Recently, I’ve spent a considerable amount of time discussing how interest rates are going to rise. Investors should know how to capitalize on rising rates, so I’ve taken on the burden of analyzing every tool I can find that provides inverse exposure. If you want to learn more about rising rates , inverse hedging tools , and capitalizing on mentioned economic behavior, read the hyperlinked articles. Today, I will do a brief comp on six different tools that can be used for hedging against rates. Each of these ETFs and ETNs are fairly small (all under 200 Mil AUM), but for the individual investor looking for inverse exposure, they’re valid options that ought to be analyzed and considered. ETFs and ETNs for Inverse Treasury Coverage The six tools I will compare are: iShares Interest Rate Hedged High Yield Bond ETF (NYSEARCA: HYGH ), ProShares High Yield Interest Rate Hedged ETF (BATS: HYHG ), ProShares Investment Grade Interest Rate Hedged ETF (BATS: IGHG ), Barclays Inverse U.S. Treasury Aggregate ETN (NASDAQ: TAPR ), iPath U.S. Treasury 5-Year Bear ETN (NASDAQ: DFVS ), and PowerShares DB 3x Short 25+ Year Treasury Bond ETN (NYSEARCA: SBND ). HYGH HYHG IGHG TAPR DFVS SBND Average NAV 91.31 71.17 75.59 37.04 32.23 5.31 52.10833 Avg. Vol 7,143 19,191 17,655 4,080 4,282 59,285 18606 12-Mo Yield 5.85% 5.65% 3.52% 0% 0% 0% 2.503% Expense 0.55% 0.5% 0.3% 0.43% 0.75% 0.95% 0.58% Total Assets 105 135.22 166.3 24.45 3.94 42.52 79.57167 HYGH is a high-yield fund with positions in iShares iBoxx High Yield Corporate Bond ETF (NYSEARCA: HYG ) and short positions in Treasury futures. HYGH moves inversely to yields while providing high interest payments primarily through riskier bonds (avg. B rating). What HYGH lacks in volume, it makes up for in yields and exposure. Its 55 bps expense is fair. I would recommend HYGH for risk-taking investors seeking high interest payments and inverse exposure. For all intents and purposes, HYHG performs identically to HYGH. It is also a high-yielding bond ETF with built-in inverse exposure. I believe HYHG (yes, it’s confusing) is slightly better though because it holds a more diversified long portfolio, and it has more AUM. It also has a higher average bond quality (B+). Its expense ratio is lower as well (marginally) at 0.5%. HYHG is also more heavily traded on the market, which is beneficial to higher net worth investors. Finally, the last high-yield bond with inverse exposure is IGHG. IGHG has the most AUM; however, it has the lowest yields of the three. IGHG’s low yields are compensated by stronger underlying assets (average A – A- bond quality). DFVS, TAPR, and SBND are ETNs (with no income distributions) and expenses ranging from 0.58 bps to 0.95 bps that provide inverse exposure to Treasury yields. The benefit of an ETN is that it provides additional exposure, and the opportunity for higher returns (particularly in the short term). I believe there are better options on the market (like ProShares UltraShort 20+ Year Treasury ETF ( TBT), ProShares Short 20+ Year Treasury ETF (NYSEARCA: TBF ), and Direxion Daily 20+ Year Treasury Bear 3x Shares ETF (NYSEARCA: TMV ) for example). This article is for the sake of coverage and comparison. I will note that SBND resets monthly rather than daily. This monthly reset allows SBND to avoid some of the pitfalls inherent with tracking and compounding error . SBND is 3x leveraged, however, which comes with its own risks . Correlation To visually express correlation between these tools, and ten-year rates, I created a chart with each ETF/ETN. DFVS comes closest, though each security does generally follow the ups and downs of fluctuating rates. The Bond/Hedge combos are less volatile because they are composed of high-yield bonds (which don’t fluctuate as much) as well as Treasury futures. TAPR and SBND, because of time frame coverage and leverage, trade on a higher daily/monthly multiple than actual rates. However, in the long term, both TAPR and SBND will perform optimally over the other options if rate does trend upwards. SBND and TAPR should be avoided by the risk-averse investors. All mentioned securities show a desired level of correlation to Treasury rates. Conclusion HYGH, HYHG, and IGHG offer an interesting combination of income and inverse leverage. TAPR, DFVS, and SBND are pure ETNs that provide expected inverse exposure. The three ETNs are inferior to other options on the market in my opinion. The three Bond/Inverse combos, however, offer an interesting (potentially risky) avenue for long-term capitalization. Disclosure: I/we have no positions in any stocks mentioned, and no plans to initiate any positions within the next 72 hours. (More…) I wrote this article myself, and it expresses my own opinions. I am not receiving compensation for it (other than from Seeking Alpha). I have no business relationship with any company whose stock is mentioned in this article.

Why Investors Should Not Party Like It’s 1999

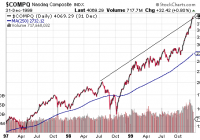
In 1999, it was the dot-com revolution that caused investors to ignore the exorbitant valuations and pitiful breadth. In 2015, it is the remarkably low cost of capital as provided by central banks worldwide that is causing investors to dismiss ridiculous valuations and dismal market internals. Stocks are super expensive today, much like they were in 1999. Yet are the stock market internals (breadth) genuinely as weak as they were back in 1999? No, they are not. The take home? Employ a tactical asset allocation strategy and stick with it. Tens of thousands of investors read my commentary at popular financial portals. Some have been reading my articles for more than a decade. Others might have clicked on a social media “follow” link in the last month or the last last year. Ironically, few realize that I originally developed a front-n-center persona on national talk radio in the late 1990s. The medium was unique in the way that listeners felt like they had a connection with me (a.k.a. “the G-Man”) and I felt connected to them. In fact, I felt a responsibility to help people understand investment mania as well as how to protect one’s self from devastating loss. Scores of folks in 50 some-odd cities may have listened for entertainment and perspective. On the other hand, many of those individuals did not take my words to heart. For instance, in 1999, I compared the stocks on the New York Stock Exchange (NYSE) with those that traded on the NASDAQ. The NYSE Composite had been flattening out over the final year-and-a-half of the 1990s whereas the NASDAQ Composite appeared to be charting a near-vertical course northward. Not only that, the records for the NASDAQ had been occurring on sky-high valuations and declining NASDAQ market internals (breadth). The bleak combination warranted caution. I did not tell investors over the radio airwaves to sell every equity holding. After all, the NASDAQ’s uptrend remained intact due to a handful of market-cap leaders still shouldering the work-load. Instead, I suggested tactical asset allocation shifts to prepare for the inevitable bearish turn somewhere down the pathway. Lighten up on the more aggressive holdings that had already experienced the greatest gains. Shift a bit to value. Raise cash equivalents for future buying opportunities. And pick up a bit more of investment grade bonds. The generalized recommendation to reduce the risk of loss was a winner in practice. Many who had lost 50%, 60%, 70% of their net worth pleaded for specialized asset management. Indeed, the 2000-2002 tech wreck is the reason that I was able to start my own Registered Investment Adviser that focused on the growth and protection of retirement portfolios. Flash forward to present day euphoria. The collective sentiment of the go-for-growth crowd is that central banks will never allow recessionary pressures to build; relatively low rates and/or the possibility of additional measures to create money electronically will be there to prop up equities should the economy or market confidence stumble. In 1999, it was the dot-com revolution that caused investors to ignore the exorbitant valuations and pitiful breadth. In 2015, it is the remarkably low cost of capital as provided by central banks worldwide that is causing investors to dismiss ridiculous valuations and dismal market internals. Are valuations really that ridiculous right now? Undoubtedly. And it does not matter if you prefer cyclically-adjusted price ratios (e.g., PE10), current price ratios (e.g., price-to-sales), the Buffett Indicator (market-cap-to-GDP) or a dividend yield-earnings yield combo. One can only decide that, like 1999, valuations no longer matter in a “New Economy,” or that 10-year returns for buy-n-hold will be woeful. In contrast, one could raise cash and less risky assets in his/her portfolio to buy at lower prices than currently exist. “Okay, Gary,” you concur. Stocks are super expensive today, much like they were in 1999. Yet are the stock market internals (breadth) genuinely as weak as they were back in 1999? No, they are not. That said, stock market breadth is noticeably shaky and growing shakier by the moment. Take a look at the ability of today’s NASDAQ to keep powering forward in price, albeit at a slightly slower pace, even as declining issues have started to overwhelm advancing issues. The similarity to the late 1990s is discernible. The take home? Employ a tactical asset allocation strategy and stick with it. By adjusting your portfolio’s mix when more caution is warranted, you will improve your risk-adjusted returns over time. For instance, when sky-high valuations couple with weak market internals, a 65% growth/35% income investor might downshift to 50% large-cap equity/30% investment-grade income/20% cash. Another person might be more risk averse, and decide that 40% large-cap equity/25% investment-grade income/35% cash places him/her in a better position to weather a future storm. Naturally, there is a flip side here. When low-to-fairly valued prices couple with improving market internals, a tactical asset allocation strategy would call for more risk. It would be time for the moderate investor described above to rebalance back to his preferred level of 65% growth/35% income. Moreover, the growth would likely include smaller-caps as well as higher-yielding income on the other side of the ledger. I recognize that not everyone wishes to engage a tactical asset allocation strategy. Fair enough. Still, those who paid attention when I addressed valuation and breadth concerns to a national audience in 1999 did not meet with disaster in 2000-2002; those who read my articles and recession warnings in 2008 did not experience the level of devastation that many experienced in the 2008-2009 financial collapse. Similarly, to the extent that you may experience apprehension about setting your portfolio on cruise control – to the extent that you wonder about the sense of holding onto the most aggressive securities in your accounts forever and ever – consider your alternatives. Perhaps hold onto assets like the iShares S&P 100 ETF (NYSEARCA: OEF ) , the Health Care Select Sect SPDR ETF (NYSEARCA: XLV ) and the iShares MSCI USA Minimum Volatility ETF (NYSEARCA: USMV ) ; perhaps let funds like the iShares Russell 2000 ETF (NYSEARCA: IWM ) go until the time that we have more attractive valuations and improving market internals (breadth). Disclosure: Gary Gordon, MS, CFP is the president of Pacific Park Financial, Inc., a Registered Investment Adviser with the SEC. Gary Gordon, Pacific Park Financial, Inc, and/or its clients may hold positions in the ETFs, mutual funds, and/or any investment asset mentioned above. The commentary does not constitute individualized investment advice. The opinions offered herein are not personalized recommendations to buy, sell or hold securities. At times, issuers of exchange-traded products compensate Pacific Park Financial, Inc. or its subsidiaries for advertising at the ETF Expert web site. ETF Expert content is created independently of any advertising relationships.