Tag Archives: nasdaq

Top 3 iShares ETFs Provide Exposure To The Health Care Sector
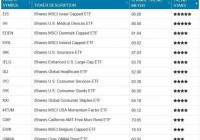
Summary The Top 3 iShares ETFs in our data base are EIS, IHI and EDEN. Large exposure to the health care area, in one form or another, is the common factor among the three ETFs. This sector has strong fundamentals driven by government mandated health reforms pushing managements to action. Introduction July was a choppy month in the markets, with Greece driving the headlines. The markets sold off during the Greek rebellion, rallied in relief when Greece agreed to tough bailout conditions, and sold off quickly heading into the Federal Reserve’s FOMC meeting. Then it bounced again, when the FOMC issued a dovish statement after its meeting. During this volatility, the three iShares ETFs that rose to the top of our medium-term rankings (see Figure 1) were the iShares MSCI Israel Capped ETF (NYSEARCA: EIS ), the iShares U.S. Medical Devices ETF (NYSEARCA: IHI ) the iShares MSCI Denmark Capped Investable Market Index ETF (BATS: EDEN ). The common factor uniting all three top iShares ETFs is the dominant exposure to the health care area in their portfolios. (click to enlarge) Figure 1: The best trending iShares ETFs from the ETFmeter.com database. (Chart courtesy ETFmeter.com ) The Common Factor EIS has approximately 26% of its assets in Teva Pharmaceuticals (NYSE: TEVA ). The world’s largest manufacturer of generic drugs this week announced it had purchased Allergan’s generic drug business. The deal just adds depth to its generics portfolio plus more growth opportunities, and pushed TEVA to a new high following its major breakout in early 2014. For EIS, its top 10 holdings account for nearly 70% of its assets, and add exposure to Israeli banks, industrials, telecom, and materials. The correlation between the performance of EIS and TEVA is a strong 79% (see Figure 2). (click to enlarge) Figure 2: Teva Pharmaceuticals is the largest holding of EIS, and the correlation between the two is 0.79 and rising (see lower graph). (Chart Courtesy StockCharts.com and ETFmeter.com) Medtronic, Abbot Labs and Thermo Fisher Scientific are the three top holdings of the iShares U.S. Medical Devices ETF, accounting for more than 30% of the ETFs assets. Almost 82% of the fund’s assets are in just 20 stocks. In our analysis, eight of the top 20 stocks are rising strongly. Its best performing stocks this month are Bard (NYSE: CR ) and Intuitive Surgical (NASDAQ: ISRG ). The long-term correlation between IHI and Medtronic (NYSE: MDT ), its largest holding, is 0.94 (see Figure 3). (click to enlarge) Figure 3: Medtronic is the largest holding of IHI, and the correlation between the two is 0.94 (see lower graph). (Chart Courtesy StockCharts.com and ETFmeter.com) The EDEN iShares Denmark ETF has broken out to new highs, and it has Novo Nordisk (NYSE: NVO ) to thank for it. A bit more than 22% of the ETF’s assets were in Novo Nordisk, with its top 10 holdings accounting for some 64% of the assets, scattered amongst the mega shippers and brewers. Novo Nordisk focuses on diabetes drugs and assorted pharmaceuticals. Lately, the 200-day correlation between EDEN and NVO is about 0.98, which means that the ups and downs of EDEN have closely followed the fortunes of NVO (see Figure 4). (click to enlarge) Figure 4: Novo Nordisk is the largest holding of EDEN, and the correlation between the two is 0.98 (see lower graph). (Chart Courtesy StockCharts.com and ETFmeter.com) Looking Ahead Health care stocks have been amongst the best performers for the past several years. Health care reform in the U.S. has pushed managements into action, and the fundamental drivers for the sector are likely to remain strong for the foreseeable future. Thus, these iShares ETFs are likely to have a wind in their sails far beyond the horizon. Disclosure: I/we have no positions in any stocks mentioned, and no plans to initiate any positions within the next 72 hours. (More…) I wrote this article myself, and it expresses my own opinions. I am not receiving compensation for it. I have no business relationship with any company whose stock is mentioned in this article.
Best And Worst Q3’15: Industrials ETFs, Mutual Funds And Key Holdings

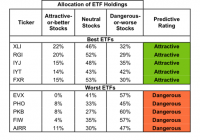
Summary Industrials sector ranks third in Q3’15. Based on an aggregation of ratings of 19 ETFs and 17 mutual funds. XLI is our top-rated Industrials ETF and FSRFX is our top-rated Industrials mutual fund. The Industrials sector ranks third out of the 10 sectors as detailed in our Q3’15 Sector Ratings for ETFs and Mutual Funds report. It gets our Neutral rating, which is based on aggregation of ratings of 19 ETFs and 17 mutual funds in the Industrials sector. See a recap of our Q2’15 Sector Ratings here. Figures 1 and 2 show the five best and worst-rated ETFs and mutual funds in the sector. Not all Industrials sector ETFs and mutual funds are created the same. The number of holdings varies widely (from 20 to 347). This variation creates drastically different investment implications and, therefore, ratings. Investors seeking exposure to the Industrials sector should buy one of the Attractive-or-better rated ETFs or mutual funds from Figures 1 and 2. Figure 1: ETFs with the Best & Worst Ratings – Top 5 (click to enlarge) * Best ETFs exclude ETFs with TNAs less than $100 million for inadequate liquidity. Sources: New Constructs, LLC and company filings Figure 2: Mutual Funds with the Best & Worst Ratings – Top 5 (click to enlarge) * Best mutual funds exclude funds with TNAs less than $100 million for inadequate liquidity. Sources: New Constructs, LLC and company filings The Fidelity Select Environment and Alt Energy Portfolio (MUTF: FSLEX ) and the Rydex Transportation Fund (MUTF: RYPIX ) (MUTF: RYPAX ) are excluded from Figure 2 because their total net assets are below $100 million and do not meet our liquidity minimums. The Industrial Select Sector SPDR ETF (NYSEARCA: XLI ) is the top-rated Industrials ETF and the Fidelity Select Transportation (MUTF: FSRFX ) is the top-rated Industrials mutual fund. Both earn an Attractive rating. The First Trust RBA American Industrial Renaissance ETF (NASDAQ: AIRR ) is the worst-rated Industrials ETF and the ICON Industrials Fund (MUTF: ICIAX ) is the worst-rated Industrials mutual fund. Both earn a Dangerous rating. 418 stocks of the 3000+ we cover are classified as Industrials stocks. Deere & Company (NYSE: DE ) is one of our favorite stocks held by Industrials ETFs and mutual funds and earns our Attractive Rating. Since 2008 the company has grown after-tax profit (NOPAT) by 8% compounded annually. Deere currently generates a top-quintile return on invested capital ( ROIC ) of 16%. Falling agriculture prices have brought Deere’s stock price down over the past year, and we think this drop gives long-term investors an excellent buying opportunity. At its current price of $92/share, Deere has a price to economic book value ( PEBV ) ratio of 0.6. This ratio implies the market expects Deere’s profits to permanently decline by 40%. This expectation seems unduly low and likely reflects a market overreaction to issues and a failure to recognize the leading position Deere holds in the agriculture industry. Deere currently has an economic book value , or no growth value of $153/share – a 66% upside. FedEx Corporation (NYSE: FDX ) is one of our least favorite stocks held by Industrials ETFs and mutual funds and earns our Very Dangerous rating. Since 2007 the company has only been able to grow NOPAT by 1% compounded annually. Over the same time frame, ROIC has fallen from 9% to 6% and NOPBT margins have fallen from 11% to 9%. When generating over $40 billion in revenue, a 200 basis point decline in margin greatly affects FedEx’s profitability. Despite these fundamental issues, the risk in the stock’s high valuation should give investors pause. To justify its current price of ~$170/share, FedEx must grow NOPAT by 10% for the next 24 years . Expecting the company to increase its NOPAT growth rate tenfold and maintain that rate for 24 years after years of lackluster NOPAT growth seems risky. Figures 3 and 4 show the rating landscape of all Industrials ETFs and mutual funds. Figure 3: Separating the Best ETFs From the Worst ETFs (click to enlarge) Sources: New Constructs, LLC and company filings Figure 4: Separating the Best Mutual Funds From the Worst Mutual Funds (click to enlarge) Sources: New Constructs, LLC and company filings D isclosure: David Trainer and Max Lee receive no compensation to write about any specific stock, sector or theme. Disclosure: I/we have no positions in any stocks mentioned, and no plans to initiate any positions within the next 72 hours. (More…) I wrote this article myself, and it expresses my own opinions. I am not receiving compensation for it. I have no business relationship with any company whose stock is mentioned in this article.