RHS – A Defensive ETF Rises
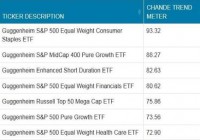
Summary Are these the worst of times? A worried market plays defense. Defensive sectors related to the consumer have risen to the top, such as the RHS ETF. Even though U.S. GDP data have picked up, until earnings improve, defensive sectors will have their day. Introduction When large institutions circle the wagons, they buy consumer staples, because we must spend on food, household cleaning products, over-the-counter medicines and feed that nicotine habit even in the worst of times. The Guggenheim S&P Equal Weight Consumer Staples ETF (NYSEARCA: RHS ) has risen to the top of our rankings of Guggenheim funds (see Figure 1). What does this mean? (click to enlarge) Figure 1: Strongest Guggenheim ETFs (data courtesy ETFmeter.com ) The RHS ETF Holdings. The Guggenheim RHS ETF has 37 stocks, with “equal” weights. The typical weight is around 2.7%, though some are as high as 3.05 percent. Approximately 37% represent Food Products, 21% represent Beverages, 19% represent Food and Staples Retailing, 10% represent Household Products and 8% represent tobacco. The top five best trending stocks in RHS are Mondelez International (NASDAQ: MDLZ ), Brown-Forman (NYSE: BF.B ), CVS Caremark (NYSE: CVS ), Kimberly Clark (NYSE: KMB ) and Monster Beverage (NASDAQ: MNST ). About half of the stocks are rising strongly. The five weakest stocks, and therefore, stocks representing best “value” are Keurig Green Mountain (NASDAQ: GMCR ), Mead Johnson (NYSE: MJN ), WalMart (NYSE: WMT ), Sysco (NYSE: SYY ) and Whole Foods Markets (NASDAQ: WFM ). Consumer Staples: The Strongest Sector within S&P 500 We analyze the major sub-sectors within the S&P 500 index over the medium-term, and find that Consumer related sectors are at the top of the trend strength, with materials and energy at the bottom. The latter have suffered due to a stronger dollar and weakness in China. Figure 2: A summary of medium-term trend analysis of S&P 500 sectors (data courtesy etfmeter.com ). S&P 500 Earnings Forecasts Come Down and Valuations Rise In their analysis of the latest reported Q2 earnings by S&P 500 companies (see Reference 1 below), Zacks reports overwhelmingly, companies have been “guiding down” on Q3 and Q4 earnings for 2015. They estimate that the guidance is for -4% year-over-year earnings decline for Q3 earnings, and a -0.8% decline in Q4 year-over-year earnings growth. This could explain the rise in defensive stocks. In other earnings news, FactSet.com report (see Reference 2 below) that the 12-month forward P/E ratio for the S&P 500 index is 16.7 per their estimates, above the 5-year and 10-year averages. Both data services expect growth to resume in 2016. However, for the rest of the year, valuations are richer than long-term trends, and earnings are expected to be lower, year-over-year. Putting the two together, the defensive posture by large investors seems justified. U.S. Economic Activity has picked up U.S. GDP data have been revised substantially in the latest releases complicating the interpretation of trends (see Reference 3 below). However, the Chicago Fed NAI shows the economy gaining strength (see Figure 3 and Reference 4 below). (click to enlarge) Figure 3: The Chicago Fed National Activity index recast in an investor-friendly format shows the economy bouncing back in Q2. The data are supportive of higher equity prices over the long-term (data courtesy ETFmeter.com ). Looking Ahead The rise in Consumer Defensive sectors reflects the uncertainty about future earnings in 2015. The economy has begun to pick up, but there is always a lag before the improvement shows up in earnings. The recent weakness in China, coupled with the knock-on effects from the Greek rebellion in Europe and a strengthening dollar (in anticipation of an interest rate hike in the U.S.) have lowered earnings guidance. Till the two opposing forces are of roughly equal strength, perhaps into 2016, consumer related stocks are likely to maintain their recent strength. References Sheraz Mian of Zacks: ” Q2 Earnings Season: All Around Weakness – Earnings Trends ” FactSet Earnings Insight ( July 24, 2015 ) Steve Liesman: ” U.S. Government revised earlier GDPs to fix anomalies in reporting ” Tushar Chande, ” SPY, QQQ, IWM: Full Trend Analysis of Major Market ETFs ” Disclosure: I/we have no positions in any stocks mentioned, and no plans to initiate any positions within the next 72 hours. (More…) I wrote this article myself, and it expresses my own opinions. I am not receiving compensation for it. I have no business relationship with any company whose stock is mentioned in this article.