REM And The mREITs
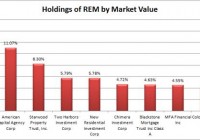
Summary The mREIT sector faces a few headwinds. Book value for most mREITs fell hard in the second quarter, but the prepayments were a much larger economic problem than the widening of spreads. Wider spreads are painful as they come into existence, but they are healthy. The iShares Mortgage Real Estate Capped ETF (NYSEARCA: REM ) can be viewed in a few manners. Some people may analyze it as a traditional ETF filled with companies that have a similar line of work, while others may try to tackle it at a more macroeconomic level. In my opinion, a macroeconomic view of REM makes sense. While REM is an ETF, it is filled with mREITs which in turn act as option-embedded leveraged bond funds. Investors choosing to buy REM are most likely doing it for the yield on the ETF rather than for capital appreciation, however it is wise to understand the factors that will influence the level of dividends that can be paid by the underlying securities. The Underlying Securities REM’s top 10 holdings are displayed below: (click to enlarge) The top 2 holdings, Annaly Capital Management (NYSE: NLY ) and American Capital Agency Corp. (NASDAQ: AGNC ), make up just over 26% of the portfolio. These mREITs frequently will at least modify their exposures to the MBS market. For instance, Annaly Capital Management recently announced that they would begin diversifying into non-Agency MBS. That sounds like a good move since it should reduce volatility that comes from having a portfolio that was too heavily focused. American Capital Agency Corp. on the other hand decided to modify their strategy lately by reducing leverage due to expectations for movements in prices that would negatively impact mREITs with higher levels of leverage. In short, investors should recognize that each mREIT may be slightly different from one quarter to the next in their holdings which causes the overall the risk profile to change for each security. Despite having a fairly heavy focus on the top few securities there is still a fairly reasonable amount of diversification within the ETF. Therefore, investors will want to consider what factors can influence the performance of the entire sector. Sector Headwinds Generally speaking the mREITs will own long-term loans in the form of MBS and use a moderate amount of hedging closer to the middle of the yield curve. They will finance the position with short-term borrowing. For an mREIT that is going to hedge heavily the difference between the yield on their long-term MBS assets and the rate they pay on their interest rate swaps is critical in determining how much income the mREIT can make. For an mREIT that does substantially less hedging, the short-term rates on their repo agreements are extremely important. Going light on hedges means more risk but higher returns if the repo rates stay low. The risk of short-term rates increasing materially over the next few years is a real challenge to mREITs. If they hedge out most of the risk with heavy use of interest rate swaps, their potential income is severely limited. If they do not hedge heavily against the risks then increases in repo rates could hammer their net interest income, while declining values of MBS (yields up, prices down) would hammer their book value. The Ugly Beast of Refinancing A major challenge for mREITs has been the availability of refinancing options because the loans are sold to the mREITs at a premium to par which means a very early repayment of the loan results in material losses of book value for the mREITs. Refinancing is an ugly negative sum game. The home owners win but the holder of the loan loses. If this were simply an even trade off, it wouldn’t be so bad. Unfortunately there is real work involved and someone has to pay for that work. Someone has to oversee and approve the refinancing of the debt. The payments must be handled and the forms signed. Labor has a real price and it must be baked into the MBS in one manner or another. If refinancing was severely reduced I would believe it would be extremely favorable for mREITs. Spreads Many mREITs had a terrible second quarter in large part due to MBS rates increasing more than interest swap rates. When the MBS rates are increasing the mREIT has a loss on the value of their assets. When the swap rates increase the mREIT records a gain on their derivative that helps to offset the loss on the value of the assets. When the MBS rates are increasing more than the swap rates the result is that many mREITs will record substantial losses in book value. When these spreads widen the mREITs report a loss in book value. Are Wider Spreads Worse? If a widening of the spreads creates a loss of book value, does that make wider spreads worse? Imagine yourself contemplating launching your own one man (or woman) mREIT. You’re contemplating investing in MBS that yield 3.5% and financing it with short-term debt. However, you don’t want the interest rate risk so you could use an interest rate swap to receive the short-term rate and pay a medium-term rate. You would receive the yield on the MBS, pay the short-term rate on your financing, receive the short-term rate from your swap, and pay the medium-term rate on the swap. The two middle steps are effectively canceling each other out so that you would expect to receive the MBS yield and pay the swap rate. If the asset yields 3.5%, would you rather pay 1%, 2%, or 3% on the swap? Hopefully in this scenario you can recognize that you want to pay the lowest rate possible, so 1% would easily be the winner in this scenario. Unfortunately, I’ve met many investors in mREITs that do not understand this mechanism. They become so caught up in the complexities that they miss out on the simple parts of the bigger picture. When spreads were widening during the second quarter it meant that asset yields went up by more than the swap rates. Since the mREITs were already locked into swap rates and MBS assets they were reporting a loss on book value. However, if you wanted to invest a new dollar into this activity it would have been more favorable to do it at the end of the second quarter than at the end of the first quarter. Conclusions The mREIT sector deserves a smaller discount to book value at the end of the second quarter than at the start of the first quarter. The mREITs lost book value from widening spreads, but the wider spreads provide the room for better levels of interest income. If spreads widened again it would mean more book value losses, but I would be willing to pay a value closer to book value when buying mREITs. If refinancing was curtailed, I would expect lower levels of prepayments, lower amortization charges, and consequently better yields on MBS assets. A smaller discount to book value at the end of Q2 does not mean a higher price because the book value we are discounting from is also lower. In my opinion, the sector had good reason to fall after getting hammered by prepayments however the fall was more substantial than I would have considered reasonable. When book value falls on spreads becoming wider and the discount to book value increases at the same time, I see a market failure that makes the mREITs more attractive. I recently added to my position in Dynex Capital (NYSE: DX ) because I felt the discount to book value given the movements in rates was not warranted. Disclosure: I am/we are long DX. (More…) I wrote this article myself, and it expresses my own opinions. I am not receiving compensation for it (other than from Seeking Alpha). I have no business relationship with any company whose stock is mentioned in this article. Additional disclosure: Information in this article represents the opinion of the analyst. All statements are represented as opinions, rather than facts, and should not be construed as advice to buy or sell a security. Ratings of “outperform” and “underperform” reflect the analyst’s estimation of a divergence between the market value for a security and the price that would be appropriate given the potential for risks and returns relative to other securities. The analyst does not know your particular objectives for returns or constraints upon investing. All investors are encouraged to do their own research before making any investment decision. Information is regularly obtained from Yahoo Finance, Google Finance, and SEC Database. If Yahoo, Google, or the SEC database contained faulty or old information it could be incorporated into my analysis.