Tag Archives: mutual funds

Best And Worst: Small Cap Value ETFs, Mutual Funds And Key Holdings

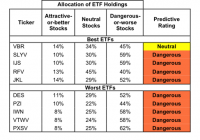
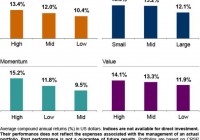
Summary Small Cap Value ranks 11th in 2Q15. Based on an aggregation of ratings of 16 ETFs and 287 mutual funds. VBR is our top rated Small Cap Value ETF and SPSCX is our top rated Small Cap Value mutual fund. The Small Cap Value style ranks 11th out of the 12 fund styles as detailed in our 2Q15 Style Rankings report . It gets our Dangerous rating, which is based on aggregation of ratings of 16 ETFs and 287 mutual funds in the Small Cap Value style. Figures 1 and 2 show the five best and worst rated ETFs and mutual funds in the style. Not all Small Cap Value style ETFs and mutual funds are created the same. The number of holdings varies widely (from 14 to 1511). This variation creates drastically different investment implications and, therefore, ratings. Investors should not buy any Small Cap Value style ETFs or mutual funds because only one gets an Attractive-or-better rating, but it has below $100 million in total net assets. If you must have exposure to this style, you should buy a basket of Attractive-or-better rated stocks and avoid paying undeserved fund fees. Active management has a long history of not paying off. Figure 1: ETFs with the Best & Worst Ratings – Top 5 (click to enlarge) * Best ETFs exclude ETFs with TNAs less than $100 million for inadequate liquidity. Direxion Value Line Small and Mid Cap High Dividend ETF (NYSEARCA: VLSM ) and First Trust Mid Cap Value AlphaDEX ETF (NYSEARCA: FNK ) are excluded from Figure 1 because their total net assets are below $100 million and do not meet our liquidity minimums. Figure 2: Mutual Funds with the Best & Worst Ratings – Top 5 (click to enlarge) * Best mutual funds exclude funds with TNAs less than $100 million for inadequate liquidity. Vanguard Small-Cap Value ETF (NYSEARCA: VBR ) is the top-rated Small Cap Value ETF and Sterling Capital Behavioral Small Cap Value (MUTF: SPSCX ) is the top-rated Small Cap Value mutual fund. Both earn a Neutral rating. One of our favorite stocks held by VBR is Goodyear Tire and Rubber Company (NASDAQ: GT ). In 2014, Goodyear earned an after-tax operating profit ( NOPAT ) of almost $1.4 billion, its highest ever in our model. Despite a 7% revenue decline, the company’s NOPAT was up over 11% year over year. Longer term, NOPAT has risen by 24% compounded annually since 2009. This is a direct result of cost of sales that declined 26% and SGA that declined 4% from 2011, bringing total expenses down by 21%. All of this expense trimming has raised Goodyear’s after-tax margins to almost 8%, up from 4% in 2012 and its return on invested capital ( ROIC ) from under 6% in 2012 to 9% today. Goodyear Tire was our Stock Pick of the Week several weeks ago. Despite the positive growth of the business, the stock is undervalued. If Goodyear can grow NOPAT by just 1% compounded annually for the next 10 years , the company is worth $37/share – a 19% upside from current levels. It will be difficult for Goodyear to fail to beat expectations as low as these when considering the company’s historical profit growth rate since 2000 is 18% compounded annually. PowerShares Fundamental Pure Small Value Portfolio (NYSEARCA: PXSV ) is the worst rated Small Cap Value ETF and Aston River Road Independent Value Fund (MUTF: ARIVX ) is the worst rated Small Cap Value mutual fund. PXSV earns a Dangerous rating and ARIVX earns a Very Dangerous rating. One of the worst rated stocks held by Small Cap Value funds is Almost Family Inc. (NASDAQ: AFAM ). Almost Family provides home health services throughout the United States. Since 2010, Almost Family’s NOPAT has declined from $32 million to $15 million in 2014, a decline of 17% compounded annually. ROIC has also seen a similar decline, down from 19% to 5% over the same timeframe. Almost Family has also generated negative economic earnings for the past two years. Considering the lack of growth shown above, AFAM is currently overvalued. To justify its current price of $39/share, the company would need to grow NOPAT by 15% compounded annually for the next 11 years . This seems very optimistic given that AFAM’s NOPAT has declined since 2010. Figures 3 and 4 show the rating landscape of all Small Cap Value ETFs and mutual funds. Figure 3: Separating the Best ETFs From the Worst ETFs (click to enlarge) Figure 4: Separating the Best Mutual Funds From the Worst Funds (click to enlarge) Sources Figures 1-4: New Constructs, LLC and company filings Disclosure: David Trainer and Allen L. Jackson receive no compensation to write about any specific stock, style, style or theme. Disclosure: I/we have no positions in any stocks mentioned, and no plans to initiate any positions within the next 72 hours. (More…) I wrote this article myself, and it expresses my own opinions. I am not receiving compensation for it. I have no business relationship with any company whose stock is mentioned in this article.

5 Buy-Ranked Financial Mutual Funds

Most of the recently released economic data, including encouraging job numbers, a flurry of positive housing market data and improving consumer sentiment, suggested that the economy is gradually gaining strength. This raised the possibility of a rate hike in the near future. It is speculated that the Fed will raise interest rates by the end of this year. The rate increase will expand margins for brokerage firms, insurance companies, banks, and money managers. Further, the increased interest rates would enable banks to earn more on the spread between interest rates for savings accounts and certificates of deposit. Meanwhile, the financial sector witnessed an encouraging first quarter earnings season. In this favorable environment, investors may find it profitable to invest in financial mutual funds that are poised to benefit from a possible rate hike. Below we will share with you 5 financial mutual funds . Each has earned either a Zacks #1 Rank (Strong Buy) or a Zacks #2 Rank (Buy) as we expect these mutual funds to outperform their peers in the future. Franklin Mutual Financial Services Fund A (MUTF: TFSIX ) seeks capital growth. TFSIX invests a lion’s share of its assets in undervalued companies that are involved in the financial services domain. TFSIX may also invest in merger arbitrage securities and securities of distressed companies. TFSIX may invest a significant portion of its assets in non-US securities. The Franklin Mutual Financial Services Fund A fund returned 15.4% in the last one year. As of March 2015, TFSIX held 88 issues with 3% of its assets invested in American International Group Inc. (NYSE: AIG ) Schwab Financial Services Fund (MUTF: SWFFX ) generally invests in equities of financial services companies. These companies may include asset management firms, brokerage companies, commercial banks, insurance companies and real estate investment trusts (REITs). The Schwab Financial Services Fund returned 12.6% in the last one year. SWFFX has an expense ratio of 0.90% as compared to the category average of 1.52%. Fidelity Select Insurance Portfolio (MUTF: FSPCX ) seeks capital growth over the long run. FSPCX invests a large chunk of its assets in companies that are involved in operations including underwriting, selling, distribution of insurances related to property, casualty, life, or health. FSPCX focuses on acquiring common stocks of companies throughout the globe. FSPCX considers factors including financial strength and economic conditions before investing in securities of a company. The Fidelity Select Insurance Portfolio fund is non-diversified and returned 10.8% in the last one year. Peter Deutsch is the fund manager and has managed FSPCX since 2013. T. Rowe Price Financial Services Fund (MUTF: PRISX ) invests a major portion of its assets in common stocks of companies from the financial services sector. PRISX may also invest in other companies that earn a minimum of half of its revenues from finance sector. PRISX uses bottom-up analysis to invest in companies that are believed to have an impressive growth potential. The T. Rowe Price Financial Services Fund returned 17.5% in the last one year. PRISX has an expense ratio of 0.87% as compared to the category average of 1.52%. Davis Financial Fund A (MUTF: RPFGX ) seeks long-term capital appreciation. The Davis Investment Discipline is utilized to invest a majority of RPFGX’s assets in companies involved in the financial services industry. Companies that have the majority of their assets related to financial services or derive a minimum of half of their revenues from the financial services domain are selected by RPFGX’s advisors for investment. Davis Financial Fund A returned 13.8% in the last one year. Christopher Cullom Davis is the fund manager and has managed RPFGX since 2014. Original Post

The Factor-Based Story Behind Successful Growth Funds

Summary Most large cap stock active fund managers underperformed their benchmarks in the 15 years to December 2014. Active large growth funds performed much better than large value funds vis-à-vis benchmarks. Virtually all of actively managed growth funds’ outperformance can be explained by quantitative multi-factor analysis. Americans have invested trillions of dollars in actively managed mutual funds in the hope of beating an index such as the S&P 500 or the Russell 1000 Growth. At Gerstein Fisher, we believe that markets tend to do a pretty good job of pricing risk and that most investors are better off “buying the market” (via an index fund) than trying to beat it. But we also think that there’s a better way to invest in equities than through either purely passive indexing or traditional active management. I’ll get to that method shortly after sharing summary results of a multi-step fund performance study that we recently conducted. Active Funds and Benchmarks We analyzed two Morningstar categories of funds, large cap growth and large cap value, from January 1, 1990 to December 31, 2014. During this 15-year period, 37% of the growth funds and 42% of the value funds disappeared-liquidated, merged, etc. We studied this aspect to eliminate survivorship bias in the study; obviously, funds that are shuttered by managers tend to be the poor performers. In the next step, we measured how many of the surviving funds outperformed their benchmarks during the 15-year time frame. Of the large cap growth survivors, 67.5% beat their benchmark (Russell 1000 Growth), while just 49% of the living value funds beat their bogey (Russell 1000 Value). All told, 42% of the large cap growth funds that existed in January 1990 beat their benchmark, compared to only 28% of large cap value funds. Moreover, the average outperformance for active growth was 2.14 percentage points per year vs. just 1.17 points for the active value funds. Two conclusions we can draw from this research are that 1) It is very difficult for professional portfolio managers to outperform an index, and 2) Growth appears to be the investing style that quite consistently performs best among actively managed funds. In fact, neither of these conclusions is either particularly new or surprising, as past research by Gerstein Fisher and others has amply demonstrated. See, for example, ” In Mutual Funds, is Active vs. Passive the Right Question? ” Explaining Outperformance But here is where the research gets really interesting. We conducted an extensive statistical analysis of the large cap growth funds that outperformed. We drilled down and studied whether quantifiable company characteristics, or “factors”, could be used to explain the outperformance. We honed in on just four factors– size, value, momentum and profitability-to measure the extent to which excess exposure (relative to the Russell 1000 Growth Index) to these factors could explain outperformance. I’ll digress very briefly to explain the theory and evolution of multi-factor investing. In 1976, Steve Ross published a landmark paper on Arbitrage Pricing Theory, which explained that security returns are best explained by more than one factor.* Since then, academics have identified dozens of quantifiable variables, such as momentum, that impact stock returns. In effect, even stocks from different industries that share similar such characteristics should generate similar returns. The Exhibit below illustrates the premiums over a 40-year period for the four factors we used to analyze the active growth funds. Note, for instance, that investors were historically rewarded with a 3-point premium (per year) for investing in more profitable companies and 3.5 points for being in smaller companies. (click to enlarge) Now back to our study. When we accounted for the momentum, size, value and profitability factors, we found that only 1.6% of the managers actually outperformed the benchmark (after adjusting for positive tilts to these four factors), or generated positive alpha (i.e., excess return of a fund relative to its benchmark). Another way of stating this is that 98.4% of the outperformers had higher factor exposure than the benchmark. For example, 95% of these winners had a positive tilt to value (relative to the Russell 1000 Growth Index) and 64% had higher-than-index exposure to smaller companies. Given this evidence that outperformance of active growth managers is almost entirely explained through their (witting or unwitting) excess exposure to certain factors, the next question is whether there is a rigorous, methodical, quantitative way to target certain factor exposures in order to outperform the index over extended time periods. We believe that there is-the Multi-Factor® quantitative investing style that underpins our three equity mutual funds. In the coming weeks, I plan to write a series of articles to elaborate on the principles and applications of multi-factor investing. In advance of that, I invite you to read a short piece we recently published on this investment strategy: ” What is a Multi-Factor Investment Approach? ” Conclusion Active fund managers have great difficulty beating passive indexes over long time periods. Actively managed growth funds perform well relative to benchmarks compared to value funds, but nearly all of the growth funds’ outperformance can be explained quantitatively by multi-factor analysis. *Finance students will recognize the factor-premium formula for portfolio return–+β11 +β22 +… … + β n n + –where portfolio return is described as the sum of the risk-free rate, factor exposures, and alpha. Disclosure: I/we have no positions in any stocks mentioned, and no plans to initiate any positions within the next 72 hours. (More…) I wrote this article myself, and it expresses my own opinions. I am not receiving compensation for it. I have no business relationship with any company whose stock is mentioned in this article.