Tag Archives: management
Construction Delayed, Bringing Down Southern Company’s Rating From Buy To Hold
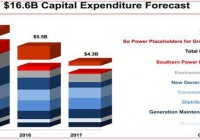
Summary SO’s near-term performance will be pressurized due to construction delays in two main projects. Completion of ongoing construction projects will improve business risk profile and portend well for stock valuation. SO’s ongoing robust investments in several solar projects will also add towards growth of long-term earnings trajectory. Challenges faced by the company due to construction delays and cost overruns will keep pressure on stock valuation. I am downgrading Southern Company (NYSE: SO ) to a ‘hold’ from ‘ buy ‘, due to challenges faced by the company in its construction projects. Despite the fact that the company’s healthy rate base earned from its strong capital investments towards growing operations in a stable and growing industry has been helping its top-line numbers grow, the ongoing construction growth remains a risk to its performance in the near term. I recommend investors to keep track of the ongoing construction projects, as in the near term, ongoing construction delays of the Kemper and Vogtle projects could hurt the company’s stock price performance. Cost overruns and delays in the ongoing projects weighed on the company’s Q4’14 results. Moreover, the ongoing construction challenges will keep pressure on stock valuations, as the company’s business risk profile has inflated due to construction delays and cost overruns. During the Q4’14 conference call, the company introduced its 2015 guidance and lowered its EPS growth range due to construction challenges. Construction Remains a Concern The company’s recent financial performance was adversely affected by cost overruns and delays. In Q4’14, the company registered an after-tax impairment charge of approximately $44 billion. SO reported an EPS of $0.38 for Q4’14, down from $0.48 in Q4’13. The company’s major growth investments in its keynote power plant projects, Kemper and Vogtle, are facing construction delays. The Kemper project is delayed, and is now expected to be in service in 1H’16. Also, the Vogtle project is delayed by 18 months. In fact, the cost overruns on SO’s 582MW coal plant Kemper prevailed in 2014. With a cost increase of $330 million, Kemper’s total construction cost escalated to almost $6.2 billion , as compared to initial estimates of $2.2 billion. As far as the construction of two nuclear plants in Vogtle is concerned, analysts have projected that if the construction of these new nuclear reactors at the Vogtle plant will be delayed just short of three years, the company might spend $8 billion to complete the construction of reactors. Along with the $8 billion construction delay costs, SO might be asked to pay $240 million in damages for falling behind schedule. I believe that in the near term, construction delays on both Kemper and Vogtle projects will weigh on its performance. But in the long run, the completion of these projects will improve SO’s production capacity and will optimize its generation portfolio. Along with its increased investments in competitive business, SO is also investing heavily to expand the generation capacity of its renewable energy generation business. As part of this plan, the company has started building a 131MW solar electricity generating plant in Georgia, which will begin its operation in 2016. This 131MW utility facility will sell electricity to three Georgia Electricity generation companies under a 25-year agreement. Owing to the longevity of the purchase power agreement done by the company, I believe the 131MW facility will deliver a significant upside to the company’s earnings base, upon completion. Moreover, SO has recently acquired two solar projects totaling 99MW from TradeWind Energy in Georgia, which include an 80MW Decatur Parkway Solar Project and a 19MW Decatur Country Solar project. The 80MW generation project, which is planned to commence this month, will sell electricity under the 25-year PPA with Georgia Power. As the projects are covered by long-term contracts, I believe that upon their commencement, both projects will add well towards growing the company’s long-term earnings trajectory. During the Q4’14 conference call, the company’s management provided the 2015 earnings guidance; SO expects the EPS for 2015 to be in a range of $2.72-$2.80/share . Due to cost overruns and delays, the company lowered its earnings growth target range to 3%-4% from 4%-5% for the future. Analysts have anticipated that SO’s earnings will grow by approximately 3.61% over the next 5 years. Along with current investments in long-term growth generating projects, the company will continue to look into all possible opportunities to make more capital investments in several growth generating projects. Also, SO, in the recent Q4’14 conference call, provided its planned 2017 capital expenditures. The company has projected a CAPEX of $16.6 billion for a three-year period from 2015 to 2017, as shown in the chart below. (click to enlarge) Source: Quarterly Earnings Reports Cash Returns SO has a strong history of making healthy cash returns to its shareholders by paying hefty dividends. In fact, due to the company’s hefty dividend payment policy, the stock has earned an attractive dividend yield of 4.60% . Moreover, SO is fully committed to following its healthy dividend payment formula in the years ahead; in the Q4’14 earnings conference call, the company’s Vice President and Chief Financial Officer, Arthur Bettie, said : We feel very confident in our ability to deliver sustainable dividend policy as we have in the past into the future. Owing to the management’s commitment towards making healthy dividend payments and due to its strong strategic growth initiatives directed at improving the company’s cash flow base, I believe that SO’s dividends remain secure. Risks The ongoing increase in construction costs due to delays occurring at both Kemper and Vogtle projects will continue to pressurize the company’s cost base in upcoming years. Moreover, increased environmental expenditure due to regulatory restrictions and decline in power demand due to weather changes are key risks hovering over SO’s future stock price performance. Conclusion I am downgrading SO from a ‘buy’ to ‘hold’ due to ongoing construction challenges. The company’s near-term performance will be pressurized due to construction delays in its two main projects. However, as the company will complete its ongoing construction projects, its business risk profile will improve and portend well for the stock valuation. The company’s ongoing robust investments in several solar projects will also add towards the growth of its long-term earnings trajectory. The ongoing challenges faced by the company due to construction delays and cost overruns will keep pressure on the stock valuation. The stock is currently trading at a lower forward P/E of 15x, as compared to the utility sector’s forward P/E of 16.8x , which I believe is justified due to ongoing construction challenges and an increase in its business risk profile. Disclosure: The author has no positions in any stocks mentioned, and no plans to initiate any positions within the next 72 hours. (More…) The author wrote this article themselves, and it expresses their own opinions. The author is not receiving compensation for it (other than from Seeking Alpha). The author has no business relationship with any company whose stock is mentioned in this article.
Cost-Efficient Exposure To Momentum
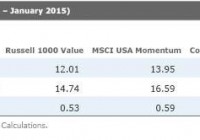
By Alex Bryan In many cases, extrapolating past performance into the future is a bad idea. In fact, securities that have outperformed for several years tend to become more expensive and priced to offer lower returns going forward. But in the short run, recent performance trends tend to persist. Winners over the past six to 12 months tend to continue to outperform for the next several months, while those that have underperformed often continue to lag. This phenomenon is known as momentum. It has been observed in nearly every market studied and across different asset classes over long periods. Investors can get efficient exposure to stocks with positive momentum through iShares MSCI USA Momentum Factor (NYSEARCA: MTUM ) for a low 0.15% expense ratio. This fund tracks an MSCI index that targets large- and mid-cap stocks with strong risk-adjusted price momentum, which differentiates it from traditional momentum strategies studied in the academic literature. This focus on risk-adjusted performance may help moderate the fund’s risk profile and reduce turnover. Volatility in a stock influences price movements, but this component of returns may not last. Risk-adjusted momentum gives a better signal of directional price movements, which may be more likely to persist. MSCI built the fund’s index with capacity in mind, at the expense of style purity. It usually only reconstitutes twice a year and applies a wide buffer to reduce turnover. On paper, momentum strategies appear to work better with reconstitution every month, as momentum is strongest over shorter windows. But in practice, monthly reconstitution can create high turnover and transaction costs. The index’s more tempered approach may improve its cost-efficiency, though it can still experience high turnover. In fiscal 2014, its turnover was as high as 123%. However, it has not yet distributed a capital gain, thanks to the exchange-traded fund structure, which allows managers to transfer holdings out of the portfolio through a nontaxable in-kind transaction with its authorized participants. Momentum is less likely to persist when volatility spikes. In order to address this potential problem, the fund’s benchmark applies conditional rebalancing in between the schedule reconstitution dates when market volatility significantly increases. When this rebalancing is triggered, the index focuses on more recent momentum to construct the portfolio. Investment Thesis In theory, investors should arbitrage any predictable price pattern away. Yet simple momentum strategies have historically worked (on paper) in nearly every market studied. Behavioral finance offers the best explanation for the momentum effect. Those in this camp assert that investors tend to anchor their beliefs and are slow to update their views in response to new information. For instance, event studies have demonstrated that stocks that beat earnings expectations have historically tended to offer excess returns for many weeks after the announcement. Similarly, stocks that miss expectations have tended to continue to underperform. Investors may also be reluctant to sell losers in the hope of breaking even and quick to sell winners in order to lock in gains. This irrational behavior may prevent stocks from quickly adjusting to new information. Once a trend is established, investors may pile on a trade or over-extrapolate recent results, pushing prices away from their fair values, which may contribute to the long-term reversals underlying the value effect (the tendency for stocks trading at low valuations to outperform). While momentum strategies have a good long-term record, they may struggle during periods of high volatility or market reversals. As a result, the fund can underperform when it is most painful. For instance, its benchmark lagged the MSCI USA Index by 3.8% during 2008. Heading into a bear market, momentum strategies tend to overweight riskier stocks, which may underperform during a correction. After a market downturn they tend to load up on defensive stocks, and they may miss out on some of the upside during a sharp recovery. There is also a risk that momentum may become less profitable as more investors attempt to take advantage of it. That said, the momentum effect hasn’t gone away even though it was first published in academic literature in 1993. Like any strategy, momentum can underperform for years. This risk may limit arbitrage and allow momentum to persist. MTUM’s moderate style tilt takes some juice out of the strategy. However, it still captures the essence of the style and at a lower cost than if it pursued a more aggressive rebalancing approach. It has a good chance of beating the market if momentum continues to pay off. But even if momentum doesn’t pan out, the fund’s low expense ratio doesn’t hurt performance much. This is a compelling holding on its own, but it can also offer good diversification benefits to value-oriented investors. That’s because momentum tends to work well when value doesn’t, and vice versa. Therefore, putting them together may reduce the risk of significantly underperforming, as the chart below illustrates. It shows the aggregate wealth accumulated in the MSCI USA Momentum Index, the Russell 1000 Value Index, and a portfolio split evenly between the two, divided by the wealth accumulated in the broad MSCI USA Index. When the line is sloping up, the strategy is beating the market, when it is sloping down, the strategy it is underperforming. Keep in mind that the MSCI USA Momentum Index’s live performance record only started in 2013. Sources: Morningstar Direct, Analyst Calculations. Portfolio Construction MTUM tracks the MSCI USA Momentum Index, which draws stocks from the market-cap-weighted MSCI USA Index, which includes large- and mid-cap stocks. In May and November, MSCI calculates the ratio of each stock’s price returns of the past 13 and seven months (excluding the most recent month to take into account the tendency for performance to reverse during that horizon) to its volatility during the past three years. There isn’t a great theoretical reason to use price returns rather than total returns, but it shouldn’t make a big difference. The index averages these two scores and selects the highest-scoring stocks until it reaches a fixed target number of stocks (currently 122). In order to reduce turnover, new constituents must rank in the top half of the index’s target number of securities to get priority over stocks that were previously in the index. Stocks already in the index only have to rank within 1.5 times the target number of securities to remain in the index. Holdings are weighted according to both the strength of their risk-adjusted momentum and their market capitalization, subject to a 5% cap. In addition to the scheduled semiannual reconstitution, MSCI may rebalance the index when the month-over-month change in the trailing three-month volatility of the market is larger than the 95th percentile of such monthly changes historically. When this occurs, the index only uses each stock’s seven-month risk-adjusted momentum score. Alternatives AQR offers some of the purest momentum funds on the market. However, these funds are only available in a mutual fund format, which can make them less tax-efficient. AQR Large Cap Momentum (MUTF: AMOMX ) (0.49%) ranks the largest 1,000 U.S. stocks by total return over the prior 12 months, excluding the most recent month, and targets the third with the strongest momentum. It weights its holdings according to both the strength of their momentum and market capitalization and rebalances monthly with an adjustment to reduce turnover. While AQR Large Cap Momentum’s $5 million minimum investment may seem a little steep, there is no minimum investment for investors who gain access to the fund through a financial advisor. AQR International Momentum (MUTF: AIMOX ) (0.65% expense ratio) and AQR Small Cap Momentum (MUTF: ASMOX ) (0.65% expense ratio) might also be worth considering. PowerShares DWA Momentum ETF (NYSEARCA: PDP ) is another option, but it is difficult to justify its 0.65% expense ratio. It targets stocks with the best relative strength and rebalances its portfolio quarterly. Historically, PDP has been less sensitive to the standard momentum factor documented in the academic literature than MTUM. Disclosure: Morningstar, Inc. licenses its indexes to institutions for a variety of reasons, including the creation of investment products and the benchmarking of existing products. When licensing indexes for the creation or benchmarking of investment products, Morningstar receives fees that are mainly based on fund assets under management. As of Sept. 30, 2012, AlphaPro Management, BlackRock Asset Management, First Asset, First Trust, Invesco, Merrill Lynch, Northern Trust, Nuveen, and Van Eck license one or more Morningstar indexes for this purpose. These investment products are not sponsored, issued, marketed, or sold by Morningstar. Morningstar does not make any representation regarding the advisability of investing in any investment product based on or benchmarked against a Morningstar index.