Tag Archives: management

Diversification Is Not Sufficient
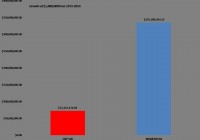
Strategy diversification may be superior to traditional methods. Momentum and trend following could provide protection during down markets. We demonstrate a simple system that can be replicated using low cost index funds. In a follow up to our recent article, Value Based Asset Allocation , we wanted to introduce you to our method for diversification. Unlike financial theory, we do not believe that diversification is sufficient for shielding a portfolio against large declines. Our view is that strategy diversification goes a long way to properly diversify a traditional asset allocation, especially during periods of market stress. Momentum is simply using price to determine the appropriate allocation. Price works as the ultimate indicator because of supply and demand. The irrefutable law of supply and demand has been the ultimate guide to navigating markets for centuries. Supply and demand governs how prices move. Therefore, price tells the true story. For example, if there are more buyers than sellers, prices will rise. If there are more sellers than buyers, prices will fall (Dorsey, 2007). Understanding what force is governing the market is critical to making allocation decisions. If supply is in control, you will want to avoid that market. On the other hand, you will want to invest in a market where demand is the stronger force. Momentum investing, by our definition, is allowing price to determine the investment allocation. It is about maintaining a harmonious relationship with the market. The idea is that the market is the sum total of all the investment experience and expertise of the market participants. The collective knowledge of the group is, in theory, superior to the individual’s over the long term. It is better to exist within a synchronous association rather than in opposition. As John Maynard Keynes suggested, “The market can stay irrational longer than you can remain solvent.” According to a trend follower, “Mr. Market” is always right, no matter how seemingly irrational. Momentum strategies have delivered superior performance to buy and hold investing (Berger, Israel and Moskowitz, 2009) . Meb Faber used a simple moving-average system to allocate to the S&P 500 or cash, demonstrating that he could reduce the correlation of his strategy to the S&P 500 in down markets to -0.38 and maintain a positive correlation of 0.83 during positive years (Faber & Richardson, 2009) . The implications of this study are profound. They indicate that by using a simple trend-following system, one can create a strategy to reduce correlation to equities when most other correlations are rising. When correlations rise during periods of market uncertainty, portfolio risk increases. Faber provides a simple solution to this particular conundrum despite using the S&P 500 as the investment vehicle. Momentum and trend following are strategies used to diversify a portfolio and cut market risk through the avoidance of large slumps. We use momentum in order to take advantage of positive herd mentality and avoid negative herd mentality. We alternate between risk-on and risk-off, dependent on the price trend of stocks and bonds. Capitalizing on the short term and herd mentality allows the investor to gain access to a return stream that does not always move in tandem with stocks and bonds. For example, during the time period from 2007 to 2009, the stock market (S&P 500) collapsed over 55 percent. Many managed-futures managers or commodity-trading advisors (CTAS) showed positive returns. Managed-futures managers are largely trend followers. Consequently, the managed-futures traders were negatively correlated with stocks and provided the ultimate diversification to a traditional portfolio. The time period from 2007 to 2009 is not unique. During several other market declines and reductions in traditional asset classes, trend-following traders demonstrated the ability to take advantage of the scrambling herd and capture impressive gains. Trend following seems high risk to many investors who still look at risk as volatility. Many momentum systems actually have higher volatility than the market. The fact is that volatility is not risk, and “the acceptance of higher risk in a trend-following investment can actually lower the risk of your stock and bond portfolios because when trend following zigs, typical stock and bond investments zag.” (M.W. Covel, 2009) Trend following appears to be an elixir for the behavioral ills of investing. Herd mentality, overconfidence, representativeness, anchoring effects, and loss aversion are all dealt with through systematic trend following, or momentum investing. We can use a simple system with indexes to replicate a strategy that protects during market declines without sacrificing the upside. In our strategy we use indices (baskets of securities tracking a particular market) to gain exposure because of their relatively low costs and high transparency. To illustrate the effectiveness of trend following historically, we are going to provide a simple, rules-based system as an example. The rules are as follows: Rank the S&P 500, Russell 2000, and the US 10-Year Treasury bond based on the three-month performance. Pick the strongest index based on the ranking. Run the ranking system each month. The important information to gather from the historical results is the performance of the momentum strategy during the years when the market declines. The ability to rotate away from the stock market when the price deteriorates allows for better performance when trouble is present. The core tenet of trend following and momentum investing is the protection of capital. Hence, the momentum strategy demonstrates the most significant outperformance during periods in which the overall stock market is experiencing large declines. The strategy performs well during positive stock market environments as well. The portfolio can be invested in the stock market when the trend is positive and stocks are stronger than bonds. In other words, the simple momentum system acts as a risk reducer during the down markets without sacrificing profits during up markets. The momentum strategy has done well compared to the S&P 500 since 1972. In the chart below, we illustrate the results to better demonstrate the benefits of incorporating trend following. If you had invested $1 million in the S&P 500 in the beginning of 1972, your investment would have grown to over $72 million by the end of 2014. If you had invested your $1 million during the same period using our momentum strategy, it would have grown to over $335 million. That is significant outperformance. Remember that the model can only maximize returns up to what the market earns. The outperformance comes from avoiding the down markets. (click to enlarge) The momentum system does not avoid declines. Since the end of 1971, there have been nine years in which the S&P 500 declined. Over the past forty years, the momentum strategy declined seven times. The beauty of momentum strategy lies in avoiding the big declines. The strategy never suffered a loss of greater than 7 percent in any given year. In comparison, the market suffered five declines over 10 percent, of which three were over 20 percent. Investors have to minimize the big declines to succeed when investing. The momentum system is able to accomplish the task of protecting the investors during big market declines, helping the portfolio grow more over the long term. As we have outlined above, momentum has historically worked to participate in up markets and protect against deep market declines. While we cannot predict the future trajectory of prices, we know that markets will fluctuate, and we have designed portfolios to potentially take advantage of market volatility. Trend-following traders have demonstrated their ability to navigate the uncertain markets and capitalize on turmoil. Trend following is not only reserved for the Wall Street elite or the ultra-rich. You can apply the same principles to diversify your portfolio using simple index funds and at a fraction of the cost of paying a manager. Disclosure: I/we have no positions in any stocks mentioned, and no plans to initiate any positions within the next 72 hours. (More…) I wrote this article myself, and it expresses my own opinions. I am not receiving compensation for it. I have no business relationship with any company whose stock is mentioned in this article. Additional disclosure: HYPOTHETICAL PERFORMANCE RESULTS HAVE MANY INHERENT LIMITATIONS. NO REPRESENTATION IS BEING MADE THAT ANY ACCOUNT WILL OR IS LIKELY TO ACHIEVE PROFITS OR LOSSES SIMILAR TO THOSE SHOWN. IN FACT, THERE ARE FREQUENTLY SHARP DIFFERENCES BETWEEN HYPOTHETICAL PERFORMANCE RESULTS AND THE ACTUAL RESULTS SUBSEQUENTLY ACHIEVED BY ANY PARTICULAR TRADING PROGRAM. PAST RESULTS DO NOT GUARANTEE FUTURE RETURNS. HYPOTHETICAL PERFORMANCE FOR ILLUSTRATION PURPOSES ONLY.
¡Viva España!

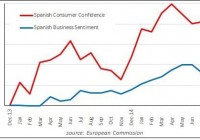
After getting off to a roaring start at the beginning of the year, Spanish equities hit a wall in May. A variety of factors affected them: a spike in interest rates, political upheaval and concern about “contagion” from Greece, as well as some renewed concern about some unchanging issues. Spanish stocks will have to climb a wall of worry, but conditions suggest that they could. Spain ought to outperform the rest of the Eurozone on a twelve-month view. The Spanish economy has grown steadily since Q2 2011, at an accelerating pace, and is on track to grow 3.2% this year, helped by an increase in tourism ─ the strong Pound, a wet summer and travelers’ difficulties with Greece’s cash-only economy boosted Spanish H1 tourist receipts by 7.4%. But tourism is not the only driver of Spain’s recovery, which is broadly-based, and is even beginning to be felt (tentatively) in construction. As this chart implies, growth has been driven by consumption rather than investment or exports, although both of the latter have been healthy. Spanish economic reforms have made the economy considerably more resilient than it was in the darkest days of the Euro Crisis, but there is still much more to be done, so Spaniards could not witness Greek developments with equanimity. The Spanish 10-year bond yield, which had fallen pretty steadily since July 2012, climbed from 1.15% in mid-March to 2.41% in mid-June on fears of “contagion.” It is currently 2.07%. Like consumer confidence, Spanish equities, which had been performing very strongly since the beginning of the year, reacted badly as well: While equities have recovered from the depth of the market’s fears on July 7 (the Tuesday before the crucial Greek parliamentary vote), they do not seem to have recovered their former brio . Several things that are worrying Spanish investors are not new ─ in fact they are perennials. However, Spain’s recent history has brought them once more very much to the fore. One is the structural defects of its labor market. It is indicative that something is very wrong that the Q2 report of 22.4% unemployment, years since the economic crisis, represents improvement. You have to go back to the 1970s to see a reading of less than 5%: even during the boom years it failed to breech 8%. The job creation that has brought it down from 26.9% in Q1 2013 has mostly involved temporary or rolling contract positions. The job protections created by early post-Franco governments are dying, but far too slowly to be helpful to the unemployed. In the meantime, unionized employers that cannot circumvent them simply do not hire, and their workforce just ages. Youth unemployment, while down from its peak, is a still-staggering 49.2%. Persistent unemployment has led to disaffection, amply illustrated by the defeat of traditional parties of government in May’s municipal elections. A significant victor was the Podemos (“We Can”) party, which advocates repudiating the national debt, etc ., but numerous new groups and special interests (civil servants, people who want mortgage forgiveness) won seats. Those who were happy to use their municipal votes for protest might hesitate to elect such groups to parliament; further, the treatment of Greece may cause Spaniards to reconsider support for them. But a national election must be held by December 20th, and it is doubtful whether the economic benefits that current government policy will continue to generate in the meantime will be so dramatic as to change many minds. Thoughtful citizens cannot help but be alarmed. Another perennial worry is separatism. Catalan independence is traditionally a leftist cause, but unlike the Scots, its advocates do not aspire to build Socialism on someone else’s dime. Catalonia is comparatively wealthy, with industrial traditions that are still intact rather than sentimental memories: it could probably be a viable state. Discontent that finds expression elsewhere as “Occupy”-type anarcho-populism, channels easily into separatism in Catalonia. Last November’s referendum saw 80.8% support for independence. Although there were reservations about the value of this exercise ─ some estimated turnout as low as a third, despite minors’ and non-citizens’ participation ─ it certainly does not suggest that support for Catalan independence has dimmed. There are also concerns about deflation. These have hovered over the entire Eurozone, but Spanish prices have contracted by a rather disturbing 6.2% over the last year: It is not surprising that business sentiment, as shown in the first chart, is lagging so noticeably behind consumer confidence. All of which amounts to quite a wall of worry for Spanish equities to surmount. However, if construction is in fact recovering, that will do much to cut into unemployment, as will continued strength in tourism. Both would help youth employment. Greece’s failure to persuade other Europeans to continue to prop up its grotesque economic policies must surely have discredited the more wild-eyed notions of how to escape austerity. Catalan independence will probably overshadow Spain indefinitely: last year’s poll indicates that the flame still burns, but it was too flawed to suggest that concerted efforts toward secession will materialize soon. While the refusal of Spanish prices to increase remains a concern, there is little evidence that they are still contracting (since January, almost all the reported price decline is due to energy). So the Spanish glass is half full as well as half empty: classic conditions under which equity prices can climb a wall of worry. Will they do so? The chances are pretty good. Interest rates can be expected to return to levels closer to those of March. The European Union’s fudge on Greece is sufficient to push those concerns to the back of many minds. Continued economic gains may not help the current government’s electoral chances much, but they cannot hurt. Friday’s report of June industrial production saw it drop 1.4% drop in Germany, 1.1% in Italy, and 0.1% in France, while gaining 0.4% in Spain, suggesting that the Spanish economy will continue to grow more strongly than those the Eurozone generally. Yet other Eurozone equity markets have not been as lackluster as Spain’s in the last week, improving Spain’s relative value in a context where its economy is clearly outperforming theirs. The fundamental attractions that drove the IBEX Index up 22% from trough to peak during its January to May rally are still in place, and in many cases have improved further. There are three Spain ETFs available in the U.S., but the iShares MSCI Spain Capped ETF (NYSEARCA: EWP ) is the only very usable one. The others, SPDR MSCI Spain Quality Mix ETF (NYSEARCA: QESP ) and iShares Currency Hedged MSCI Spain ETF (NYSEARCA: HEWP ), have AUM of only $2.5 million and $3.8 million respectively, making them essentially illiquid. EWP has AUM of $1.7 billion. Disclosure: I/we have no positions in any stocks mentioned, and no plans to initiate any positions within the next 72 hours. (More…) I wrote this article myself, and it expresses my own opinions. I am not receiving compensation for it (other than from Seeking Alpha). I have no business relationship with any company whose stock is mentioned in this article.

Otter Tail Corporation: Unofficially Nudging Forward

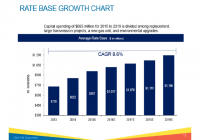
Otter Tail Corporation reported 2015 second quarter results on August 3rd. Based on its performance, the company unofficially increased its full-year EPS projection. Six months in, the company’s potential to cover both its annual dividend and corporate costs looks solid. Even considering Otter Tail traditionally pays a dividend exceeding the average of diversified utilities, the company’s share price is not yet out of fair value range. The allure of owning a diversified utility is the blend of a stable, healthy dividend and the potential of share price appreciation. Otter Tail Corporation (NASDAQ: OTTR ) operates as an electric utility in northern states in the Midwest and as a manufacturer of plastics, PVC pipe and metal fabrication. The company reported second quarter results on August 3rd. After a first quarter reset 9% to 10% downward of full-year estimates, the company unofficially raised full-year estimates in its second quarter reporting. The overall effect is still a decrease from the company’s original guidance. But, the bump now represents improvement over 2014 results which can be extrapolated into safety of the dividend and potential for share price improvement. Otter Tail’s first quarter results were mixed in its manufacturing segment, Varistar. The segment was unexpectedly tripped up by the downturn in the oil and gas industry. The second quarter performance still showed some impact but the company was better able to manage the challenges. The loss of sales to manufacturers of oil and gas equipment was partially offset by sales to manufacturers of lawn and garden equipment, recreational equipment and wind energy equipment. Year-over-year, the segment’s revenue in the quarter decreased 4%. On the bottom line, the segment’s operating income increased 8.6% year-over-year. The primary contributor to the difference was lower resin prices. Otter Tail sold more pounds of PVC pipe at lower prices but it cost the company much less to do so. Relative to its core business of being an electric utility, the company’s performance was favorable in the second quarter. The weather is, obviously, beyond the company’s control. To date, 2015 has offered milder seasons. In the 2014 second quarter, compared to “normal”, both the heating degree days and cooling degree days exceeded 100%. By comparison, in 2015, the heating degree days registered only 82.7% of normal and cooling degree days registered 78.9% of normal. Sales in the quarter were lower to both retail and wholesale customers. This loss was offset by ECR (environmental cost recovery) rider revenue related to the company’s ACQS (air quality control system) environmental upgrade project and higher transmission tariff revenue from MISO (Midcontinent Independent System Operator) related to increased investment in regional transmission lines. The slide below from the latest investor presentation depicts the regulated rate base capital expenditures for the next 5 years which will drive growth: (click to enlarge) Contributing directly to the segment’s bottom line, the company’s production fuel costs and maintenance expenses were lower in the quarter. Year-over-year, the segment’s operating income and net income increased over 50%. The second quarter delivered $0.36 in EPS from continuing operations, a 71% increase compared to the 2014 second quarter. Year-to-date, the EPS total of $0.73 is still lagging 2014 by 10%. In 2014, full-year EPS was $1.55. Otter Tail’s original guidance for 2015 was a range of $1.65 to $1.80. With the first quarter results, the range was adjusted to $1.50 to $1.65. In the second quarter press release, Otter Tail management stated it “now expects to be in the middle to upper end of the range”. The company did not formally adjust the range. But, the statement unofficially moves the guidance to $1.57 to $1.65. Based on the company’s strategy, the utility segment’s earnings are to support the dividend paid to shareholders. The 2015 EPS projection for the segment is $1.23 to $1.26. The company’s current annual dividend rate is $1.23. The Varistar segment’s earnings are intended to cover corporate costs and drive share price appreciation. The current full-year projection per share for this segment is $0.50 to $0.58. Corporate costs are projected in a range of $0.19 to $0.23 per share. Compared to 2014 where corporate costs totaled $0.22 per share for the full year, the company is currently operating at just 80% of the 2014 rate. An adjustment to full-year EPS warrants an adjustment in a buy point for Otter Tail. Using the unofficial full-year EPS range of $1.57 to $1.65 equates to a midpoint of $1.61. At a dividend rate of $1.23, the payout ratio based on the unofficial midpoint would be less than 80%. Acknowledging Otter Tail, at 4.4%, has consistently paid above the average yield for diversified utilities, any price up to $30.75 maintains a yield of 4%. As well, any price below $30.75 equates to a P/E ratio equal to the average P/E ratio of 19.09 for the Utilities sector. Disclosure: I am/we are long OTTR. (More…) I wrote this article myself, and it expresses my own opinions. I am not receiving compensation for it (other than from Seeking Alpha). I have no business relationship with any company whose stock is mentioned in this article. Additional disclosure: I belong to an investment club that owns shares in OTTR.