Tag Archives: management

Investing With The Slowskys: Appreciating The Value Of Expertise, Analysis And Judgment

Ideas and news items with obvious implications get quickly discounted by the market. Diversity breakdown is one of the greatest threats to market efficiency and therefore reasonably accurate price discovery. A good deal of evidence suggests that just such a diversity breakdown has been occurring. Sources of “slow traveling ideas” that can maintain a truly independent perspective will likely prove investors’ best antidote to institutional biases and short-termism. For do-it-yourselfers, frugal consumers, and efficiency seekers, the proliferation of the internet, smart mobile devices, and high speed connectivity has been a remarkable boon that has more than offset many economic headwinds. We can pull up a how-to video in YouTube in seconds (and for free) rather than calling a contractor for a minor repair, we can buy ebooks at a fraction of the price of hard copies, and we save all kinds of physical trips with online applications, emails, video calls, etc. Investors have realized their own bonanza with free online news, price data, and research that used to cost investment firms tens of thousands of dollars. As the cost of information has declined, its consumption has exploded to create an ever-more frenetic, information intensive society. We see evidence of this everywhere including in communications advice to limit messages to “a few bullet points” and to use “punchy, catchy language.” While information resources have done a great deal to improve convenience and to keep investors better informed, there is one big thing they haven’t done and cannot do: improve long-term investment performance. That free information cannot improve investment performance may seem counterintuitive, but it actually reveals a key characteristic of reasonably efficient markets: When information is free and easy to acquire, you only have what everyone else has — and it gets discounted into stock prices almost instantaneously. This challenge begs the larger question of how to outperform markets that are mostly efficient and was addressed beautifully in well-worn, but still relevant, research by Jack Treynor and Michael Mauboussin. Treynor laid solid intellectual foundations for the challenge in his 1975 piece, “Long term investing” [ here ]. He tells us: When one talks about market efficiency, it is important to distinguish between ideas whose implications are obvious and consequently travel quickly and ideas that require reflection, judgment, and special expertise for their evaluation and consequently travel slowly. The second kind of idea … is the only meaningful basis for ‘long-term investing’. So a direct answer to the challenge of how to outperform is to acknowledge that data points, news bits, and other items “whose implications are obvious” do not provide a meaningful basis for long-term investing. Deeper analysis is required. But there is also a more subtle implication from Treynor’s insights: opportunities for outperformance arise when significant portions of market participants make the same error or act in the same way. In particular, Treynor articulates the importance of the assumption of independence in regards to market efficiency: As the key to the averaging process underlying an accurate consensus is the assumption of independence, if all — or even a substantial fraction — of these investors make the same error, the independence assumption is violated and the consensus can diverge significantly from true value. The market then ceases to be efficient in the sense of pricing available information correctly. Mauboussin also picks up on this thought [ here ]. According to Mauboussin, markets fail because, “Most simply, investor heterogeneity breaks down and everyone acts in unison, leading to excessive optimism (greed) or pessimism (fear).” So what really matters for markets functioning well is for a diverse group of investors to each make decisions independently. Although diversity breakdowns don’t occur frequently, when they do, Mauboussin notes that they “provide investors with significant opportunities to earn excess rates of return.” Interestingly, a fair bit of evidence suggests that we may be in the midst of just such a diversity breakdown. For one, it is no secret that many institutional incentives exist that work in opposition to investors’ best interests. Mauboussin highlights some of these: Current incentives encourage agent behavior that is not always consistent with maximizing long-term shareholder returns (Bradford Cornell and Roll, 2005). In recent decades many large investment firms have emphasized marketing (often at the expense of the investment process), increased the number of funds they offer (selling what’s hot), and boosted the number of stocks they hold in order to minimize tracking error versus the benchmark. He notes further, But perhaps the most significant incentive-caused behavior, and most relevant for a discussion of how to beat the market, is the reduction in investment time horizons. According to Bogle (2005), average equity portfolio turnover rose from 20% in the mid-1960s to 112% in 2004. And fund managers aren’t the only ones with shorter time horizons; Bogle documents that mutual fund owners redeem shares at a rate four times higher than a few decades ago. While this data is not completely fresh, the trends have not changed and in the case of exchange trade funds (ETFs), are far worse. If these conditions weren’t already enough to warrant concern, recent industry trends suggest the risk of diversity breakdown has been increasing. The 2104 Investment Company Factbook describes, for example, that: The growth of individual retirement accounts (IRAs) and defined contribution (DC) plans, particularly 401(k) plans, explains some of households’ increased reliance on investment companies during the past two decades. In other words, progressively greater chunks of money have been flowing to institutions that have the same set of biases. Unfortunately, there’s more. The Fed’s policies since the financial crisis have likely made these challenges to market diversity even worse. With investment firms already fairly uniformly predisposed towards remaining fully invested in order to preserve near term revenues, the Fed’s policies of keeping interest rates near zero and explicitly targeting higher asset prices has made it even harder for investment firms to buck the trend. Further, any efforts on the part of money managers to independently manage risk over the last several years have been severely punished by the effects of new iterations of quantitative easing and other extraordinary monetary policy tools. In summary, the last several years of market activity have created a nearly perfect storm of short-termism. While the magnitude of diversity break down can be fairly debated, it is difficult to refute that investor heterogeneity has diminished. After all, there is no doubt that institutional investors have like incentives that cause similar behaviors and that those same institutional investors comprise a “substantial fraction” of the investor base from which it is sufficient to undermine an “accurate consensus”. Jeremy Grantham recently made a less than thinly veiled reference to these directional forces in a Financial Times article when he noted that “If you’re a naturally conservative investor and still alive, you’re doing pretty well.” What should investors take away from all of this? The most immediate implication is that there is substantial evidence that U.S. stock markets are experiencing the kind of diversity breakdown by which “consensus can diverge significantly from true value.” Industry structure, trends, and monetary policy have all combined to erode market diversity in a way that can cause significant losses — and significant gains. It could well be that having a truly independent view is one of the greatest strengths an investor can have right now. Second, and in a more general sense, investors should be extremely skeptical as to the investment value of news bits and data items. In an important sense, these results should not be surprising. As Mauboussin notes, Time horizon is a crucial consideration in any probabilistic field. In these systems, short-term results show mostly noise — the noise-to-signal ratio is very high. But over time, the signal reveals itself, and the noise-to-signal ratio drops. Short-term investors dwell mostly in the world of noise. Such tidbits may certainly be helpful in other ways, but investors should not be fooled into believing they are useful for long-term investing. Only deep research and analysis can help out on that front. Given this important and time-honored insight, it is interesting and ironic that the breakdown in investor diversity is moving in the direction of more noise and less signal. Sources of “slow traveling ideas” that can maintain a truly independent perspective will prove investors’ best antidote to institutional biases and short-termism. In conclusion, for many years, Comcast aired a commercial for its internet service that featured a couple of turtles named the Slowskys who were averse to anything that was fast. Although this portrayal was obviously a parody, it illustrates a perfectly appropriate maxim for investing: Slow traveling ideas are a long-term investor’s best bet for delivering superior results. Disclosure: I/we have no positions in any stocks mentioned, and no plans to initiate any positions within the next 72 hours. (More…) I wrote this article myself, and it expresses my own opinions. I am not receiving compensation for it. I have no business relationship with any company whose stock is mentioned in this article.
Consider MLPX For Distribution Growth And Total Return

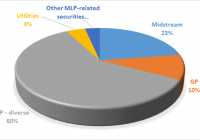
Summary GPs generally exhibit lower yields than MLPs, but can provide higher distribution growth and total return rates. The Global X MLP & Energy Infrastructure ETF is a fund that contains a high proportion of GP or GP-holding companies. This article analyzes the composition and distribution growth profile for this ETF. Introduction The general partners (GP) vs. master limited partnerships (MLPs) question has been addressed recently on Seeking Alpha. In an Oct. 2014 article entitled ” Look At The MLP GP Companies For An Alternate Path To High Total Returns “, author Tim Plaehn explains: The pure-play MLP general partner companies offer a different way to participate in the results of the partnerships they sponsor and manage. The GP companies leverage the growth rates of the LP distributions, providing more of a total return investment potential based on high distribution or dividend growth rates. A similar conclusion was reached by Seeking Alpha author Harry Domash ” General Partners Outperform Their MLPs ” (Aug. 2014). Investors who are uncomfortable with picking individual stocks may prefer owning a basket of funds. Are there any exchange-traded products that own only GPs? The answer is no, but there is a fund that comes close: the Global X MLP & Energy Infrastructure ETF (NYSEARCA: MLPX ). Fund details MLPX appears to be a little-known fund, with only 161 followers on Seeking Alpha. Pertinent fund details are shown in the table below (data from Morningstar ): MLPX Yield (ttm) 3.17% Expense ratio 0.45% Inception Aug. 2013 Assets $106M Avg Vol. 103K No. holdings 40 Avg. Cap $15.2B Annual turnover 29% Morningstar rating NR Composition The 40 constituents of MLPX are given in the table below. Also shown is the % assets, ttm yield, market cap and type of each constituent . The % assets are obtained from the fund’s website while the ttm yield and market cap are obtained from Morningstar. In categorizing the type of company, I have used the classification types in the CBRE Clarion Securities MLP Master List website, which considers these following MLP or MLP-related classes: [i] traditionally structured midstream MLPs, [ii] upstream MLPs, [iii] traditionally structured other MLPs (“other”), [iv] variable distribution MLPs (“variable”), [v] MLP GP holding companies (“GP”), [vi] other publicly-traded companies that own GP interest in an MLP, but the GP stake is not their only asset (“GP – diverse”), and [vii] other MLP-related securities. Name Ticker Assets / % Yield / % Cap / B Type MARATHON PETROLEUM CORP (NYSE: MPC ) 10.17 1.79 30.2 GP – diverse WILLIAMS COS INC (NYSE: WMB ) 9.97 4.50 38.3 GP – diverse ENBRIDGE INC (NYSE: ENB ) 8.83 3.29 36.7 GP – diverse TRANSCANADA CORP (NYSE: TRP ) 8.68 4.43 26.3 GP – diverse CHENIERE ENERGY INC (NYSEMKT: LNG ) 6.95 0.00 16.0 GP – diverse SPECTRA ENERGY CORP (NYSE: SE ) 6.76 4.81 20.7 GP – diverse EQT CORP (NYSE: EQT ) 4.44 0.15 12.0 GP – diverse ONE GAS INC (NYSE: OGS ) 4.34 2.66 2.3 Utilities ENTERPRISE PRODUCTS PARTN (NYSE: EPD ) 4.30 5.23 57.1 Midstream ONEOK INC (NYSE: OKE ) 4.18 6.37 7.9 GP TARGA RESOURCES CORP (NYSE: TRGP ) 4.05 4.12 4.4 GP SEMGROUP CORP-CLASS A (NYSE: SEMG ) 3.78 2.21 2.6 GP – diverse ENBRIDGE ENERGY MANAGEMENT (NYSE: EEQ ) 3.37 0.00 2.0 Other MLP-related securities MAGELLAN MIDSTREAM PARTNERS (NYSE: MMP ) 2.34 4.02 16.0 Midstream PLAINS ALL AMER PIPELINE (NYSE: PAA ) 2.12 7.38 14.6 Midstream ENLINK MIDSTREAM LLC (NYSE: ENLC ) 2.00 3.73 4.2 GP ENERGY TRANSFER PARTNERS (NYSE: ETP ) 1.94 2.10 25.3 Midstream WILLIAMS PARTNERS LP (NYSE: WPZ ) 1.53 7.44 25.3 Midstream MARKWEST ENERGY PARTNERS (NYSE: MWE ) 1.52 6.57 11.0 Midstream BUCKEYE PARTNERS LP (NYSE: BPL ) 1.33 4.47 9.1 Midstream TARGA RESOURCES PARTNERS (NYSE: NGLS ) 0.80 9.96 6.0 Midstream ONEOK PARTNERS LP (NYSE: OKS ) 0.78 9.96 8.6 Midstream WESTERN GAS PARTNERS LP (NYSE: WES ) 0.67 4.80 8.3 Midstream EQT MIDSTREAM PARTNERS LP (NYSE: EQM ) 0.57 2.99 5.6 Midstream NUSTAR ENERGY LP (NYSE: NS ) 0.56 8.38 4.1 Midstream GENESIS ENERGY L.P. (NYSE: GEL ) 0.52 5.53 4.8 Midstream DCP MIDSTREAM PARTNERS LP (NYSE: DPM ) 0.40 10.34 3.5 Midstream SPECTRA ENERGY PARTNERS L (NYSE: SEP ) 0.40 4.65 15.3 Midstream TESORO LOGISTICS LP (NYSE: TLLP ) 0.39 5.17 4.6 Midstream TC PIPELINES LP (NYSE: TCP ) 0.37 5.93 3.7 Midstream SHELL MIDSTREAM PARTNERS (NYSE: SHLX ) 0.31 1.19 5.3 Midstream ENLINK MIDSTREAM PARTNERS (NYSE: ENLK ) 0.29 7.86 6.3 Midstream BOARDWALK PIPELINE PARTNERS (NYSE: BWP ) 0.25 2.84 3.5 Midstream TALLGRASS ENERGY PARTNERS (NYSE: TEP ) 0.22 4.25 2.8 Midstream CRESTWOOD MIDSTREAM PARTNERS (NYSE: CMLP ) 0.20 16.99 1.8 Midstream PHILLIPS 66 PARTNERS LP (NYSE: PSXP ) 0.18 2.50 4.6 Midstream MPLX LP (NYSE: MPLX ) 0.16 3.21 3.8 Midstream HOLLY ENERGY PARTNERS LP (NYSE: HEP ) 0.15 7.33 1.7 Midstream ANTERO MIDSTREAM PARTNERS (NYSE: AM ) 0.15 2.02 3.5 Midstream ENABLE MIDSTREAM PARTNERS (NYSE: ENBL ) 0.06 7.63 6.8 Midstream The allocations of MLPX are depicted in the chart below: As can be seen in the chart above, the majority (60%) of the assets of MLPX are in “GP – diverse” companies, which according to CBRE Clarion Securities are “other publicly-traded companies that own GP interest in an MLP, but the GP stake is not their only asset”. The top 7 holdings of MLPX, namely MPC, WMB, ENB, TRP, LNG, SE and EQT are all classified as “GP – diverse” companies. MLPX also holds a number (10%) of “pure” GP companies such as OKE, TRGP and ENLC, which are classified by CBRE as “companies whose primary assets are G.P. and L.P. interests in their subsidiary MLP.” Consequently, MLPX can be considered to consist of 70% of companies whose GP/LP stake in their subsidiary MLP is either their primary asset or part of their assets. Distribution growth In the past twelve months, MLPX has distributed a total of 51.9 cents. In the twelve months before that, MLPX distributed 38.9 cents. This represents a whopping 33.5% year-on-year distribution growth, on a current 3.17% yield. There is no further dividend history as MLPX has only existed for two years. However, as MLPX is an ETF, it has the ability to control the amount of distributions that it makes, including the capability of providing return-of-capital distributions. Thus, the year-on-year distribution growth of the constituents of MLPX were analyzed in order to determine whether this 33.5% dividend growth was reflective of the distribution growth of the underlying holdings. To calculate this, the recent 24-month dividend history for the 40 constituents of MLPX were extracted from Nasdaq.com , and their year-on-year distribution growth was calculated. The following chart shows the year-on-year distribution growth for the constituents of MLPX. Note that some companies are missing because they either (i) do not pay a dividend (e.g. LNG) or (ii) have less than 2 years of operating history (e.g. SHLX, OGS). As can be seen from the chart above, the year-on-year distribution growth for most of the companies in MLPX is quite robust (with the notable exception of BWP). However, each constituent of MLPX has a different weighting in the index, and therefore a different contribution of distribution growth. I therefore calculated the weighted average of the year-on-year distribution growth of these companies, and the answer came out to 15.6% . I believe that this number (as opposed to 33.5%) better reflects the distribution growth profile for MLPX going forward, if the year-on-year distribution growth for the constituents remains constant. However, considering the current state of oil prices, this may or may not be a true assumption. Performance The following graph shows the total return performance of MLPX versus the ALPS Alerian MLP ETF (NYSEARCA: AMLP ) and the JPMorgan Alerian MLP Index ETN (NYSEARCA: AMJ ) since the inception of MLPX two years ago. MLPX Total Return Price data by YCharts The graph above shows that MLPX, which consists largely of GP-holding companies, handily outperformed AMLP and AMJ, which are funds that hold only midstream MLPs. This reinforces the conclusions offered by Tim Plaehn and Harry Domash presented above. Tax implications I am not a tax expert, so please take the following discussion with a grain of salt. According to Global X , MLPX operates as a Regulated Investment Company (RIC) rather than a C-Corporation. This is because MLPX contains less than 25% of MLPs (the current allocation is 23%). In doing so, it avoids issues common in other MLP ETFs, such as corporate taxes and K-1s, and it is also IRA and 401(k) eligible. The following table is from Global X: (click to enlarge) Conclusion MLPX is a little-followed ETF whose constituents are mostly either GP or GP-holding companies. It contains less than 25% MLPs, which allows it to operate as an RIC rather than as a C-Corporation. While its current yield of 3.17% is lower than either AMLP (7.54%) or AMJ (6.08%), its actual (33.5%) and projected (15.6%) year-on-year distribution growth rates are much higher than those for AMLP (5.5%) or AMJ (2.1%). Moreover, its expense ratio is only 0.45%, compared to 0.85% for the other two funds. Finally, its total return performance since inception two years ago has significantly outpaced those of AMLP and AMJ. Hence, MLPX may be a good choice for investors seeking the total return and distribution growth of GP companies, but who are uncomfortable with picking individual stocks. Besides general equity risk, the main risk of this fund is that its constituents are highly sensitive to commodity prices, and should these continue to fall, it is likely that the share prices of the funds will fall further. Moreover, the distribution growth going forward may also be reduced from historical levels. Disclosure: I am/we are long MLPX. (More…) I wrote this article myself, and it expresses my own opinions. I am not receiving compensation for it (other than from Seeking Alpha). I have no business relationship with any company whose stock is mentioned in this article.

MORL: Twice The Risk For Not A Lot Of Fun

Summary MORL is an exchange traded note offered by UBS benchmarked to 2x the Market Vectors Global Mortgage REITs Index. The Market Vectors® Global Mortgage REITs Index is a float-adjusted, market capitalization weighted index designed to measure the performance of publicly-traded mortgage REITs. The index covers 90% the of mortgage REITs. Even though the MORL currently yields an attractive 26% distribution, it has lost significant value since inception, and last year in particular. When we meet with prospective clients, one of the questions we ask is how they have chosen their existing investments, in particular for their retirement accounts. Quite often, especially with do-it-yourself type investors, we will get two answers that make our ears cringe; 1. choosing the funds that have gained the most in the prior year, and 2. choosing the investments that yield the highest dividend or distribution. For anyone who was looking for distributable yield in the past few years, they have most likely come across many leveraged products, including the UBS ETRACS Monthly Pay 2x Leveraged Mortgage REIT ETN (NYSEARCA: MORL ) which is currently yielding a mind-blowing 26%. Anyone who had invested in this ETN experienced a noticeable disappointment, and absolutely not the under-promise, over-deliver Starbucks (NASDAQ: SBUX ) experience many learned about and love. Let’s dig in. What is the UBS ETRACS Monthly Pay 2x Leveraged Mortgage REIT ETN? MORL is an ETN issued by UBS linked to the monthly compounded 2x leveraged performance of the Market Vectors ® Global Mortgage REITs Index (the “Index”), reduced by the accrued fees. It pays a variable monthly coupon linked to two times the cash distributions, if any, on the index constituents. About the Underlying Index The Market Vectors ® Global Mortgage REITs Index (the “Index”) is a float-adjusted, market capitalization-weighted index designed to measure the performance of publicly traded mortgage REITs. The Index provides 90% coverage of the investable mortgage REIT universe based on strict size and liquidity requirements. The Index is a price return index (i.e., the reinvestment of dividends is not reflected in the Index; rather, any cash distributions on the Index constituents, less any withholding taxes, are reflected in the variable monthly coupon that may be paid to investors of the ETN). The Index was created on August 4, 2011 and has no performance history prior to that date. The UBS ETN was launched on 10/16/2012 with an initial $25.00 per share price. The ETN has an annual expense ratio of .40%. Note: VanEck, the creator of the index also sponsors their own ETF ( Market Vectors Mortgage REIT Income ETF) following this index, trading under the ticker symbol (NYSEARCA: MORT ). It is an ETF that does not employ any leverage. Performance The premise of this product is certainly intriguing, with twice the income of an asset class that is supposed to be safer than typical equities. During times of financial stability, this works out quite well. Unfortunately, mortgage REITs like BDCs and closed-end funds get thrown out with the bathwater during sell-offs and market corrections, without regards that the underlying assets may be sound and stable. Let me explain. The problem with any pooled, daily tradable investment is liquidity. That liquidity is a benefit when you know you are able to redeem your investments any time during market hours. Unfortunately, that very same liquidity and mark-to-market accounting create issues where the underlying assets may be less liquid, such as REITs and BDCs. Liquidity is what creates the need to look at both, the market price, as well as the underlying NAV of the investment. During times of financial instability, the market price per share may be significantly below the actual underlying assets. So how has it performed so far? An issue with looking at investments that have recently launched is that unless the strategy is simply bad, or the active manager is an amateur, it was tough to lose money over the last 5 years in the market. Both MORL and MORT have launched in 2012 and 2011, respectively, so let’s start there to evaluate the performance. I first ran a Morningstar hypothetical test with a $10,000 investment in MORL and MORT, starting at their earliest common date, 10/16/2012, which is the launch date of MORL. As you can see below, if you have reinvested your distributions, a $10,000 MORL investment would be worth approximately $11,624 today. It underperformed the S&P 500 quite a bit, but at least you did not lose money. A $10,000 investment in MORT would be worth approximately $11,498. Wait… a minute. At this point you may be asking yourself… you took twice the risk for a mere $126 incremental return? Yes. Not so fun. (click to enlarge) Ok. What about if you are a typical income investor looking for income to live off of, and did not reinvest any of the distributions? That is what the second illustration is for. (click to enlarge) As you can see, a $10,000 MORL investment would now be worth approximately $6,430 on your statement. A $10,000 MORT investment would be worth a more tolerable $8,444. 2008-like account statements that you would have in 2015. Speaking of 2008, how would this portfolio have performed during that time frame? Unfortunately, none of the marketing materials from VanEck or UBS brings that up. Furthermore, many of the index constituents did not exist prior to 2009. What we do have are 3 mortgage REITs out of the index that do have a trading history. Fortunately, Annaly Capital Management (NYSE: NLY ) that makes up 17% or so of the index has a long trading history, along with MFA Financial (NYSE: MFA ) and Blackstone Mortgage Trust (NYSE: BXMT ). Together, these 3 REITs make up slightly over 25% of the index. You can see the performance of those 3 over the last 10 years below. MFA was the only one able to maintain a positive share price over a 10-year period. NLY is down approximately 32%, and BXMT imploded in 2008 and never recovered netting a 91% loss in share price. (click to enlarge) So how did they do during the peaks of the bear market? Below is a chart from Jan. 1, 2008, through November 1st, 2008: (click to enlarge) NLY suffered a 23% loss, followed by MFA with a 38.8% loss, and finally BXMT with a 72.9% fall in the share price. The thing to keep in mind is that the above are with no leverage. If you were exposed to those companies through the 2x levered UBS note, your losses would be far more severe. Bottom Line Is MORL right for you? Is it really a good product, or merely another idea thrown up in order to generate fees at the expense of foolish investors who are merely looking at yield? For an institution or an experienced professional investor, this article would likely add little that they don’t already know. Those people are also more likely to trade this product, and not invest in it. For a retail investor… listen up. MORL and perhaps even MORT are sophisticated, complex investments that cannot be just bought and forgotten about. They can hurt you very badly, very, very quickly. You must absolutely track them like a hawk with a defined exit strategy in case things go bad. A big thing to keep in mind with MORL is that it is not an exchange traded fund with underlying assets. As with other UBS ETRACS products, it is an exchange traded note, which are unsecured debt obligations of the issuer, in this case UBS AG (NYSE: UBS ). In case of default, your investment is not secured in any underlying mortgage REIT. You would be standing in line with other bondholders with a claim. Besides the zero leverage in MORT, this ETN structure is the other difference between the two products. In case VanEck has issues, your ETF is invested in the underlying mortgage REITs. I do applaud UBS as it clearly makes an attempt to point out that it is a UBS unsecured note and not an ETF on its quarterly fact sheets. The other big warning is… …Don’t Let the 2x Leverage Fool You. In reality, it is far higher. What the marketing material does not go over too well is that the underlying mortgage REITs are already heavily levered. For instance, at the end of Q4 2014, NLY was levered somewhere around 4.8x, and that was a decrease from 2013 when it was more than 6x. What this UBS ETN is doing is applying a 2x leverage multiple to an already levered asset. Remind me again, wasn’t this part of the financial collapse? Is this 2015 or are we reliving 2008 all over again here? Disclosure: I/we have no positions in any stocks mentioned, and no plans to initiate any positions within the next 72 hours. (More…) I wrote this article myself, and it expresses my own opinions. I am not receiving compensation for it (other than from Seeking Alpha). I have no business relationship with any company whose stock is mentioned in this article. Additional disclosure: None of the information discussed should be considered investment advice or a solicitation to buy or sell any securities. Please consult your investment advisor for specific recommendations.