Tag Archives: lowell-herr

Dual Momentum Model Recommends Move To Bonds Or Cash

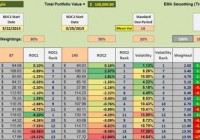
The Dual Momentum model recommended selling equities as far back as August 10th. A slight modification of the Dual Momentum model recommends holding Cash or SHY. Look-back periods make a difference in recommendations. Three metrics, as described in the second table, improve returns and reduce annual draw-downs. Momentum investors following the Dual Momentum model are currently invested in either bonds or cash depending on how strict they follow the DM guidelines. In the following table the look-back period is one year or 365 days as recommended in Gary Antonacci’s book, Dual Momentum Investing . Exchange Traded Funds representing U.S. and International Equities markets are substituted for those securities suggested in Antonacci’s book. These ETFs are commission free securities available through several discount brokerage houses. VTI covers U.S. Equities while VEU represents International Equities. If neither VTI or VEU outperforms SHY , our cutoff ETF, we move to bonds. In this momentum model an intermediate bond BIV is selected as an obvious choice. One could also use BND as the bond representative. Using the 365-Day look-back period, the current recommendation is to invest 100% in bonds. Investors may wish to wait until after the FEDs settle on an interest rate rise before making this move. (click to enlarge) An alternative model to the above DM is shown in the following screen shot. After hours of research using a Monte Carlo model, a different look-back emerges. In the following model a 30% weight is assigned to the performance over the most recent 87 calendar days while a 50% weight is assigned to the most recent 145 calendar days. To hold down portfolio volatility and reduce risk, a 20% weight is assigned to a 14 calendar day mean-variance. Following these three metrics improves performance while reducing draw-down with respect to either the S&P 500 or VTSMX benchmarks. This can also be demonstrated using out-of-sample data. Numerous portfolios are now undergoing additional testing of this three-metric model. Using these three metrics, the recommendation varies slightly from the above DM model as investors are now advised to invest 100% in SHY, the “circuit breaker” ETF. Moving to SHY or Cash was recommended as far back as August 10th . One adjustment is advised when both VTI and VEA are out of favor as is now the situation. Instead of maintaining the 30% – 50% weights assigned to the 87- and 145-day periods, reverse those percentages. The reason is to place more weight on the most recent period so as to catch the upward swing when the market begins to rebound. As for the current situation, the Dual Momentum model recommends holding 100% in bonds while the revised DM model recommends holding 100% in Cash or SHY. Both are conservative portfolio positions. (click to enlarge) Disclosure: I am/we are long SHY. (More…) I wrote this article myself, and it expresses my own opinions. I am not receiving compensation for it (other than from Seeking Alpha). I have no business relationship with any company whose stock is mentioned in this article. Share this article with a colleague

Momentum Model Recommends Investors Move To Cash

The momentum model currently recommends investing in SHY or a money market. This model outperforms the VTTVX benchmark. The momentum model also minimizes draw-down. Dual Momentum as well as other momentum models are receiving considerable attention as the momentum anomaly appears to have significant staying power. In the following ETF ranking table and the performance graph, this momentum model demonstrates how one can generate benchmark beating returns while lowering portfolio volatility. The following data table is made up of fourteen ETFs that provide global diversification. ETFs used in this example are also found in the Baker’s Dozen article with one addition, BIV, an intermediate bond fund. The fourteen ETFs are: VTI , VEA , VWO , VNQ , RWX , TIP , TLT , DBC , GLD , PCY , BIV , VOE , VBR , and SHY . This array of ETFs covers the U.S. Equities market, developed international equities, emerging market equities, U.S. REITs, international REITs, bonds, gold, commodities, and treasuries. VOE and VBR are included to take advantage of any value anomaly, should it exist. ETF Rankings: Driving the following rankings are three metrics. Performance over the past 87 calendar days. A 30% weight is assigned to this performance percentage. Performance over the past 145 calendar days where a 50% weight is assigned to this performance percentage. Low volatility is an advantage so a 20% weight is assigned to a mean-variance of 14 calendar days. Based on extensive back-testing and out-of-sample analysis, the above variables provided the best return/volatility ratio. An example of such testing is provided in the second screen-shot. As of 8/17/2015, this momentum model recommends investing 100% of the portfolio in SHY as there are no ETFs outperforming this 1-3 yr. treasury bond. Looking for ETFs that are outperforming SHY is an application of the absolute momentum principle where one does not invest in ETFs if they are under-performing the cutoff or circuit breaker ETF. SHY is that cutoff ETF. (click to enlarge) Performance Data: A frequent question is – how well does such a momentum oriented portfolio perform? Since one set of data or one back-test is insufficient to come to any conclusions, a Monte Carlo analysis is run on this set of ETFs. The portfolio is reviewed every 33 days. We are looking for ETFs that are ranked above SHY (none are in the current ranking) and if there are two, we invest equal amounts in those two securities. Should there be a tie, we invest equal amounts in the top three. ETFs under-performing SHY are sold out of the portfolio. The look-back periods are 87 and 145 calendar days as mentioned above. Beginning on 6/30/2006 we capture two bull markets and a severe bear market. The overall return of the portfolio managed using this momentum model is 287% while the VTTVX benchmark is 78%. Draw-downs (“DDs”) are always of interest and here again the momentum portfolio shines by limiting the maximum DD to 24.1% while the benchmark had a maximum DD of 27%. The average DD for the momentum portfolio was an acceptable 10.4%. The light colored or gray graphs show the 50 runs made for this set of ETFs operating under the stated guidelines. The dark line is the average. Even the worst performing run outperformed the benchmark. Not only does the momentum model provide protection against deep bear markets such as we experienced in 2008 and early 2009, the portfolio also shows a much steeper slope during the bull market since March of 2009. The above momentum model was not selected to generate the very best return. Instead, it was built to be a robust portfolio in all types of conditions. Using SHY as the circuit breaker is our volatility check and should keep one away from the depths of a bear market. The model does require discipline as one needs to review the portfolio every 33 days. The above graph shows the benefits of such discipline. Disclosure: I am/we are long VTI,SHY. (More…) I wrote this article myself, and it expresses my own opinions. I am not receiving compensation for it (other than from Seeking Alpha). I have no business relationship with any company whose stock is mentioned in this article. Additional disclosure: The back-test runs were performed by Ernest Stokely.