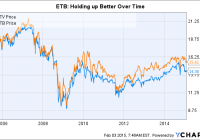
Summary At a quick glance, ETV and ETB look like almost mirror images of one another. ETV’s longer-term performance hasn’t been as good as ETB’s, based on market price. But based on total return, ETV has done a little better over time. If I had to choose, ETB would be my call. A pet peeve of mine is when a fund sponsor has two similar funds available that, on the surface, appear to be clones of one another. That’s exactly the case with the Eaton Vance Tax-Managed Buy-Write Opportunities Fund (NYSE: ETV ) and Eaton Vance Tax-Managed Buy-Write Income Fund (NYSE: ETB ). But when you look just a little closer, the differences are there – they’re just subtle. The same… One of the first things I look at when examining a fund is its objective. In the case of ETV : “The Fund’s primary investment objective is to provide current income and gains, with a secondary objective of capital appreciation.” ETB’s objective is, word for word, the same. And the managers are the same, too. With Walter A. Row and Thomas Seto heading things up since each of the funds’ initial public offerings. Which brings us to one relatively minor distinction between the two funds. ETV IPO-ed on June 30, 2005. ETB IPO-ed on April 29, 2005. This is a virtually irrelevant fact at this point, but it is a difference. Even the standard deviation, a measure of share price volatility, of the two funds is roughly the same. According to Morningstar, both funds have five-year standard deviations of about 9.5 versus a standard deviation for the S&P 500 of around 13. So they aren’t as volatile as the overall market, which can be good and bad. For example, over the trailing five-year period, they each captured around 60% of the market’s advance and 60% of the market’s decline. ETV is a touch better on both sides, gaining a little more and losing a little less. But the variance is tiny. … But different So, in a number of ways, ETV and ETB are virtual clones of each other. For example, over the trailing five-year period through the end of January (neither has 10-year numbers just yet), ETV’s annualized return is 11.4% based on its net asset value, or NAV, and 12.7% based on its share price. ETB’s annualized returns are 11% and 11.2%, respectively, over the same time span. Morningstar’s numbers are total return, which includes distributions, but it’s worth noting that the returns are fairly similar based on NAV. Furthermore, total return since the inception of each fund is only nine basis (0.09) points different based on NAV, according to Eaton Vance, bringing the pair’s performance even closer together. Yield, however, is a noteworthy differences. ETV’s yield is around 9.5%, according to the Closed-End Fund Association, and ETB’s yield is about 8.2%. Right now, ETV’s monthly distribution is $0.1108 and ETB’s distribution is $0.108. ETB’s NAV is a little over a dollar higher than that of its sibling. The biggest difference, however, is probably in the portfolios. At the end of last year, ETV’s largest sector weighting was in technology, at nearly 36% of the portfolio. That was more than double the second- and third-largest sectors combined (consumer discretionary at 14.6% and healthcare at 14%). Technology was materially overweighted relative to the S&P 500, where tech stood at roughly 20% of the index. Technology was ETB’s largest sector weighting, too. But it came in at roughly 18%, a couple of percentage points lower than the index. The financial sector, meanwhile, was the fund’s number two sector, at just a touch under 18%. The consumer discretionary sector came in third, with a weighting of about 14%. The weighting of both the consumer discretionary and financial segments were just slightly above the index. In fact, when looking at the broader portfolios based on sectors, ETB looks far more like the index than its sibling. It isn’t an index clone, but the differences are at the margins. ETV, on the other hand, is clearly making a big bet on technology – that must be where the managers see “opportunity.” The weighting given to each fund’s largest holdings is also worth a comment. ETV, for example, had over 20% of its assets in its top four holdings – all of which were tech names. And eight of the top 10 holdings were tech, with a ninth that could arguably be technology, too. ETB’s top four holdings were closer to 10% of its portfolio. In fact, you’d have to reach out to the top 10 holdings at ETB to get to 20% or so of assets. And the mix in that top 10 was comparatively diverse. “Opportunity” is the key Clearly, the use of the word “opportunity” in the name of ETV is about the fund’s ability to stray quite far from its benchmark. That’s neither good nor bad, but is something investors should keep in mind. Over the longer term (since inception) it doesn’t appear to have done too much to help performance, though over the past five years it looks like it has been a slight benefit. That said, looking at each fund’s distributions, return of capital has been a big component. The use of options strategies virtually guarantees this. However, between 2010 and year-end 2013, ETV’s NAV went from roughly $14.50 to $14.80. The NAV is currently around $14.50 again. So, over last four years, the NAV has gone virtually nowhere. ETV data by YCharts ETB, meanwhile, watched its NAV go from $15.60 at the start of 2010 to $16.25 at the end of 2013. Its current NAV is about $15.85. ETB has been better able to build value for its shareholders than ETV, if only by a little bit. That is likely attributable to the lower distribution and yield – even though ETB’s name includes the word “income.” For my money, I’d recommend ETB over ETV, leaving the upside potential of seeking out “opportunities” to someone else. Slow and steady is more my speed, because the relatively large bets that ETV is taking may pan out, but there’s the chance that they don’t. For example, if you look at NAV back to the start of 2009, ETV actually looks like a better option because of a 39% NAV advance that year, compared to ETB’s 30% increase. That said, go back one more year to 2008, and you see that ETV fell 25% more than ETB in what was a brutal year for the stock markets (ETV fell 28.5%, compared to ETB’s more modest decline of 22.8%). There are always trade-offs in investing and ETV and ETB are no exception. The differences are somewhat minor, and even where they do show up, performance hasn’t been disproportionately impacted over the long term. That leads me to err on the side of caution – the more diversified portfolio and lower distribution of ETB. Disclosure: The author has no positions in any stocks mentioned, and no plans to initiate any positions within the next 72 hours. (More…) The author wrote this article themselves, and it expresses their own opinions. The author is not receiving compensation for it (other than from Seeking Alpha). The author has no business relationship with any company whose stock is mentioned in this article.