Tag Archives: etb

Closed End Funds: Total Return Or NAV Return?

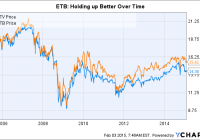
Closed-end funds are simple in concept, but complicated in practice. The big confusion comes from the frequent focus on distributions. While I believe distributions are strength for CEFs, they can also be a weakness. Closed-end funds, or CEFs, are something of an unloved stepchild in the pooled investment industry. Open-end mutual funds and exchange traded funds are the fair-haired children. But the lack of love paid to CEFs is really part of the appeal. Only you have to come to terms with how you want to measure CEF success. Returns When it comes to tracking pooled investment products you generally look at total return. This means including reinvested distributions into the performance equation. It makes sense to do this since CEFs, open-end mutual funds, and exchange traded funds are pass-through investments, meaning they have to send along any income or capital gains to shareholders. Calculating returns as if those distributions were put back to work is a simple method for including these distributions into returns and is a basic industry norm. Indeed, total return facilitates comparing funds to each other on an apples to apples basis. So, when looking at a CEF, you should consider more than just price performance. In fact, many CEFs focus on paying out large distributions. That leaves their net asset values, or NAVs, stagnant even though investors are receiving notable returns. A good example is Eaton Vance Tax-Managed Buy-Write Income Fund (NYSE: ETB ). ETB’s NAV at the start of 2010 was $15.59 a share. At the end of 2014 it was $16.31 a share. That’s an increase of 4.6% over five years. On the surface that sounds pretty abysmal. However, the fund distributed $6.98 per share over that span. Including this information completely changes the equation. And that’s why it’s important to look at total return and not just NAV. Complicating this is that CEFs trade on exchanges like stocks, but operate like mutual funds. And that leads to premiums and discounts to net asset value. Your results will be based on the market price, but when examining how a CEF is doing, you’ll want to look at NAV performance. Why? Market prices for CEFs are based on supply and demand, meaning investor sentiment rules the day. NAV is the actual performance of the portfolio. It’s a truer picture of management’s ability. But don’t forget NAV That said, you can’t forget about NAV and just look at total return. And distributions are, again, the reason. One of the big fears in the closed-end space is so-called destructive return of capital. This happens when a CEF pays out distributions while its NAV is falling. Over short periods of time this can provide shareholders with steady income, but over longer periods it can destroy a fund’s capital base and, thus, it’s ability to maintain distributions. On this front, take a look at Dreyfus High Yield Strategies Fund (NYSE: DHF ). In March 2011, the fund’s NAV was $4.08 a share. (The fund’s fiscal year ends in March.) By March 2015 the NAV had fallen to $3.84 a share. It paid out $2.22 a share in distributions over that span, producing a decent total return. However, looking beneath that, the distribution has fallen in each of the last five fiscal years. DHY’s distribution has gone from $0.52 a share in fiscal 2011 to $0.36 a share in fiscal 2015. So, yes, the fund’s trailing total returns aren’t bad. Yes, it still offers a notable yield. But the fund is getting smaller and smaller and so is the distribution. There are multiple reasons for this. One is that DHY is a high-yield fund dealing with an unusual low-rate world. So as bonds mature they are replaced with lower yielding fare. That said, with fewer assets in the fund, DHY is also hampered by the not so small fact that it can’t buy as many bonds as it could just a few years earlier. So this example shows that there are times when total return isn’t enough of a picture to decide on a CEF investment. Income for life The need to examine both total return and NAV is particularly important if you are an investor looking to live off the income your portfolio generates. In this situation you won’t be reinvesting your dividends, you’ll be spending them. And, thus, total return may be the best way to compare funds to each other, but it won’t be indicative of your portfolio’s performance or, more to the point, how long your money will last you. If your capital continues to decline over time because your CEFs pay out notable distributions that you spend while their NAVs are falling, you are in a much weaker position than total return alone might suggest. Which is exactly why destructive return of capital is such a buzz phrase. CEFs are a complex space and require a bit more thought than open-end mutual funds or exchange traded funds. And while their distributions often make them stand out from other pooled investment vehicle choices, you can’t just look at them from one angle and be done with it. So, look at total return and watch NAV. The stories each metric tells is important. Disclosure: I/we have no positions in any stocks mentioned, and no plans to initiate any positions within the next 72 hours. (More…) I wrote this article myself, and it expresses my own opinions. I am not receiving compensation for it (other than from Seeking Alpha). I have no business relationship with any company whose stock is mentioned in this article.

ETB Vs. ETV: What’s The Difference?

Summary At a quick glance, ETV and ETB look like almost mirror images of one another. ETV’s longer-term performance hasn’t been as good as ETB’s, based on market price. But based on total return, ETV has done a little better over time. If I had to choose, ETB would be my call. A pet peeve of mine is when a fund sponsor has two similar funds available that, on the surface, appear to be clones of one another. That’s exactly the case with the Eaton Vance Tax-Managed Buy-Write Opportunities Fund (NYSE: ETV ) and Eaton Vance Tax-Managed Buy-Write Income Fund (NYSE: ETB ). But when you look just a little closer, the differences are there – they’re just subtle. The same… One of the first things I look at when examining a fund is its objective. In the case of ETV : “The Fund’s primary investment objective is to provide current income and gains, with a secondary objective of capital appreciation.” ETB’s objective is, word for word, the same. And the managers are the same, too. With Walter A. Row and Thomas Seto heading things up since each of the funds’ initial public offerings. Which brings us to one relatively minor distinction between the two funds. ETV IPO-ed on June 30, 2005. ETB IPO-ed on April 29, 2005. This is a virtually irrelevant fact at this point, but it is a difference. Even the standard deviation, a measure of share price volatility, of the two funds is roughly the same. According to Morningstar, both funds have five-year standard deviations of about 9.5 versus a standard deviation for the S&P 500 of around 13. So they aren’t as volatile as the overall market, which can be good and bad. For example, over the trailing five-year period, they each captured around 60% of the market’s advance and 60% of the market’s decline. ETV is a touch better on both sides, gaining a little more and losing a little less. But the variance is tiny. … But different So, in a number of ways, ETV and ETB are virtual clones of each other. For example, over the trailing five-year period through the end of January (neither has 10-year numbers just yet), ETV’s annualized return is 11.4% based on its net asset value, or NAV, and 12.7% based on its share price. ETB’s annualized returns are 11% and 11.2%, respectively, over the same time span. Morningstar’s numbers are total return, which includes distributions, but it’s worth noting that the returns are fairly similar based on NAV. Furthermore, total return since the inception of each fund is only nine basis (0.09) points different based on NAV, according to Eaton Vance, bringing the pair’s performance even closer together. Yield, however, is a noteworthy differences. ETV’s yield is around 9.5%, according to the Closed-End Fund Association, and ETB’s yield is about 8.2%. Right now, ETV’s monthly distribution is $0.1108 and ETB’s distribution is $0.108. ETB’s NAV is a little over a dollar higher than that of its sibling. The biggest difference, however, is probably in the portfolios. At the end of last year, ETV’s largest sector weighting was in technology, at nearly 36% of the portfolio. That was more than double the second- and third-largest sectors combined (consumer discretionary at 14.6% and healthcare at 14%). Technology was materially overweighted relative to the S&P 500, where tech stood at roughly 20% of the index. Technology was ETB’s largest sector weighting, too. But it came in at roughly 18%, a couple of percentage points lower than the index. The financial sector, meanwhile, was the fund’s number two sector, at just a touch under 18%. The consumer discretionary sector came in third, with a weighting of about 14%. The weighting of both the consumer discretionary and financial segments were just slightly above the index. In fact, when looking at the broader portfolios based on sectors, ETB looks far more like the index than its sibling. It isn’t an index clone, but the differences are at the margins. ETV, on the other hand, is clearly making a big bet on technology – that must be where the managers see “opportunity.” The weighting given to each fund’s largest holdings is also worth a comment. ETV, for example, had over 20% of its assets in its top four holdings – all of which were tech names. And eight of the top 10 holdings were tech, with a ninth that could arguably be technology, too. ETB’s top four holdings were closer to 10% of its portfolio. In fact, you’d have to reach out to the top 10 holdings at ETB to get to 20% or so of assets. And the mix in that top 10 was comparatively diverse. “Opportunity” is the key Clearly, the use of the word “opportunity” in the name of ETV is about the fund’s ability to stray quite far from its benchmark. That’s neither good nor bad, but is something investors should keep in mind. Over the longer term (since inception) it doesn’t appear to have done too much to help performance, though over the past five years it looks like it has been a slight benefit. That said, looking at each fund’s distributions, return of capital has been a big component. The use of options strategies virtually guarantees this. However, between 2010 and year-end 2013, ETV’s NAV went from roughly $14.50 to $14.80. The NAV is currently around $14.50 again. So, over last four years, the NAV has gone virtually nowhere. ETV data by YCharts ETB, meanwhile, watched its NAV go from $15.60 at the start of 2010 to $16.25 at the end of 2013. Its current NAV is about $15.85. ETB has been better able to build value for its shareholders than ETV, if only by a little bit. That is likely attributable to the lower distribution and yield – even though ETB’s name includes the word “income.” For my money, I’d recommend ETB over ETV, leaving the upside potential of seeking out “opportunities” to someone else. Slow and steady is more my speed, because the relatively large bets that ETV is taking may pan out, but there’s the chance that they don’t. For example, if you look at NAV back to the start of 2009, ETV actually looks like a better option because of a 39% NAV advance that year, compared to ETB’s 30% increase. That said, go back one more year to 2008, and you see that ETV fell 25% more than ETB in what was a brutal year for the stock markets (ETV fell 28.5%, compared to ETB’s more modest decline of 22.8%). There are always trade-offs in investing and ETV and ETB are no exception. The differences are somewhat minor, and even where they do show up, performance hasn’t been disproportionately impacted over the long term. That leads me to err on the side of caution – the more diversified portfolio and lower distribution of ETB. Disclosure: The author has no positions in any stocks mentioned, and no plans to initiate any positions within the next 72 hours. (More…) The author wrote this article themselves, and it expresses their own opinions. The author is not receiving compensation for it (other than from Seeking Alpha). The author has no business relationship with any company whose stock is mentioned in this article.