Tag Archives: japan

Betting Against Japan: The Straddle Of The Century

Japan has accumulated an enormous and growing debt load. The Japanese Central Bank’s bond buying may prevent a crisis. The yen is likely to continue weakening. Investors can profit from the JCB’s moves. Japan emerged from the ashes of World War II to becoming one of the largest economic powers in the world by the 1980s. By creating high quality products and making highly publicized corporate purchases, Japan was both respected and feared by competing economic powers. Japan’s economic advancement came to an abrupt end when the Japanese market crashed in the late 1980s and never truly recovered. The once mighty power is now heavily indebted and dealing with a declining population and a declining economy. A crisis is possible, but like with crises of the past, a major Japanese economic event can become a great opportunity, particularly with the right investments. The debt load of the Japanese government stands at just under 1.2 quadrillion yen ($10.1 trillion), greatly exceeding their 484 trillion yen ($4.07 trillion) economy and the 96 trillion yen budget ($812 billion), with projected revenue at only 54.5 trillion yen. This is a precarious financial position, and at a 4.5% interest rate, the projected revenues would only cover debt service. But because the Japanese Central Bank (JCB) is such a large buyer of Japanese government bonds, the interest rate for a 10-year bond stands at under 0.5% as of the time of this writing. Given that this 1.2 quadrillion yen is a debt level unlikely to be paid off, hyperinflation or default would appear to be the only realistic options for addressing the debt. To counter a possible collapse, the JCB started buying larger amounts of bonds than the Japanese government was creating. It’s likely the JCB plans to buy up a large percentage of the outstanding bonds ( it owns about 16% now ) and simply write off the bonds, and hence, that portion of Japanese government debt. If this were to work without destroying the economy, the Japanese government strengthens its financial position by returning to sustainable debt levels. If it fails and Japanese bonds rise to double or even triple digit interest rates, default becomes a possibility. Another possible scenario involves weakening the yen. This has been seen in earnest since 2012 and born of the JCB’s larger levels of aggressive stimulus. The JCB created more yen and pumped the currency into the economy, sending the Nikkei to highs not seen since the 1990s. The price of this stimulus has been a greatly devalued yen falling from 76 to the dollar in early 2012 to the low 120s in early 2015 . Experts such as Kyle Bass predict the yen will fall beyond 140 to the dollar by year-end and further beyond this year. The potential danger of this approach is that more yen chasing the same amount of goods will devalue the yen to the point that investors lose confidence in the currency. In addition to making Japanese consumers poorer, the devalued currency could also lead to higher interest rates that also make the government debt load untenable. Investors can protect themselves from this horrifying yet plausible scenario with a different take on the straddle bet, one based on different vehicles instead of up or down bets on the same investment. In this case, it would be a position betting against Japanese government bonds (the JGBS ETF is the easiest way to accomplish this) coupled with a second bet against the value of the Japanese yen (versus a precious metal or a currency such as the US Dollar). If the JCB can successfully write off a large amount of government debt, investors can still profit from what’s likely to be substantial yen devaluation. If the worst case bond crash occurs, investors can profit or at least protect themselves from what would be a devastating economic event. The once-mighty Japanese economy now finds itself in a situation where the JCB struggles to maintain economic strength. An economic collapse would be the most devastating occurrence to hit Japan since their loss in World War II, and a catastrophic blow to a world economy where Japan exerts wide influence. However, this situation also presents a great opportunity for the prepared investor. Whether the high debt resolves itself through a dramatic collapse or by the JCB engineering a large-scale debt write off, bets on a weaker yen and higher interest rates will likely bring investors outsized returns and possibly protection in a crisis. Disclosure: The author is long JGBS, GYEN. (More…) The author wrote this article themselves, and it expresses their own opinions. The author is not receiving compensation for it (other than from Seeking Alpha). The author has no business relationship with any company whose stock is mentioned in this article.

To Hedge Or Not To Hedge?

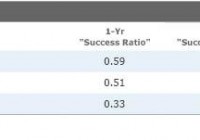
This is an updated version of an ETF Specialist originally published on Feb. 19, 2014. Currency-hedged exchange-traded funds have come into vogue of late in the United States. Investor interest was first piqued by the performance of the oldest and largest of them all: WisdomTree Japan Hedged Equity (NYSEARCA: DXJ ) . The fund owns a portfolio of dividend-paying Japanese stocks that generate more than 80% of their revenue outside of Japan. It gained nearly 42% in 2013, as a massive dose of monetary stimulus contributed to an 18% decline in the value of the Japanese yen, and steady improvement in the global economy gave Japan’s stock market an additional boost. In contrast, iShares MSCI Japan ETF (NYSEARCA: EWJ ) , which tracks a standard market-cap-weighted benchmark and does not hedge its yen exposure, increased by 26% in 2013. Clearly, it paid for U.S. investors in Japanese stocks to have a hedge against a declining yen over this span. But was this a flash in the pan, or do currency hedges have value over longer time frames? With the U.S. dollar marching steadily higher–thanks in part to (relatively) attractive interest rates–and double-digit moves in major currencies making headlines, now is a good time for investors to explore these questions. Back to Basics: Return, Risk, and the Practicalities of Putting a Currency Hedge in Place In simple terms, a domestic investor’s local-currency-denominated return in a foreign security (or a portfolio of them) is equal to the foreign security’s (or portfolio’s) return plus the foreign currency return, plus the product of the foreign security return and the foreign currency return. The last part of this equation accounts for the interplay between the two, and as it is the product of these two figures, its contribution to the overall return will grow as either the foreign asset return or the foreign security return grows larger. Domestic Currency Return = Foreign Security Return + Foreign Currency Return + (Foreign Security Return x Foreign Currency Return) The effect of fluctuating exchange rates can either help or hurt returns. In the case of U.S. investors holding Japanese stocks, the yen’s depreciation hurt the U.S. dollar return for unhedged investors in 2013, as evidenced in part by the iShares fund’s relative underperformance versus the WisdomTree offering. In another extreme example, the 34% appreciation of the Brazilian real contributed to the 124% calendar-year return posted by iShares MSCI Brazil Capped ETF (NYSEARCA: EWZ ) in 2009. These examples highlight that currency effects can be extreme in magnitude. It’s also important to consider currencies’ effect on the risk of a portfolio of foreign securities: The expression for the variance (the square root of which is the standard deviation) of a foreign security or portfolio’s returns is as follows: σ 2 $ = σ 2 LC + σ 2 S + 2σ LC σ S ρ LC,S, where σ 2 $ = the variance of the foreign asset returns in U.S. dollar terms; σ 2 LC = the variance of the foreign asset in local-currency terms; σ LC = the standard deviation of the foreign asset in local-currency terms; 2 S = the variance of the foreign currency; σ s = the standard deviation of the foreign currency; ρ LC,S = the correlation between the returns of the foreign asset in local-currency terms and movements in the foreign currency. This expression demonstrates that the volatility of a foreign asset in domestic-currency terms is directly related to the volatility of the asset in local-currency terms (the first term in the expression) and the volatility of the foreign currency (the second term). It also shows that the higher the correlation between the foreign asset in local-currency terms and movements in the foreign currency, the greater the variance will be in local currency terms. (Again, take the square root and you’ll get the standard deviation.) Hedging away currency exposure will reduce risk, as measured by standard deviation–as can be seen in Exhibit 3 below. How does currency hedging work in practice? Most currency-hedged ETFs will use currency forward contracts to reduce their foreign-currency exposure. A currency forward contract is an agreement between two parties to buy or sell a prespecified amount of a currency at some point in the future (typically one month out in the case of currency-hedged ETFs) at an exchange rate agreed upon between the two parties. Because the value of the forward contract is fixed ahead of time, and the value of the fund will fluctuate during the course of a month as asset prices and cash flows into and out of the fund fluctuate, the forward may not be a perfect hedge. It’s also important to note that these hedges come at a cost, though their price tag typically amounts to just a few basis points in the case of developed-markets currencies in stable interest-rate environments. FX Effects It is useful to look at historical data to frame the effects of currency hedging on investment performance (for U.S. investors in this case). There are two key elements to consider when assessing the effects of currencies on equity portfolios: their contribution to return (as covered above) and their contribution to risk. Exhibit 1 shows “success ratios” for a trio of MSCI benchmarks over the 20-year period ended Jan. 31, 2015. These benchmarks are all tracked by one or more currency-hedged (and unhedged) ETFs. The success ratio represents the portion of the overlapping monthly rolling one-, three-, and five-year periods over these two decades during which the unhedged version of the index outperformed its fully hedged counterpart. For example, the MSCI EAFE Index outperformed its fully hedged counterpart in 59% of these overlapping rolling one-year periods over this 20-year span. In hindsight, in the case of the MSCI EAFE and MSCI Germany benchmarks, the winner could have been predicted by the flip of a (mostly) fair coin. The story is different when it comes to the MSCI Japan Index, where “getting the yen out” has clearly paid off more often than not. Exhibit 2 contains the annualized average returns for each benchmark across each of the overlapping monthly rolling one-, three-, and five-year periods dating back 20 years from the end of January 2015. The differences in relative performance vary between the hedged and unhedged versions of these indexes depending on the length of the measurement period. The MSCI Japan Index is again a unique case, as evidenced by the yawning performance differential between its hedged and unhedged versions. What about risk? Currency risk is a significant contributor to overall risk in the context of a foreign-equity portfolio. Exhibit 3 shows the trailing 20-year annualized standard deviations and Sharpe ratios for the same benchmarks featured in the first two exhibits. In the case of all three benchmarks, it is clear–as evidenced by the difference in Sharpe ratios between the U.S. dollar and hedged versions of the indexes–that currency exposure is a meaningful source of risk, currency hedging can serve to mitigate this risk, and it may ultimately result in superior risk-adjusted performance. To Hedge or Not to Hedge? The best answer to the question of whether it makes sense to hedge the currency exposure of an international-stock portfolio is this: It depends. By hedging foreign-currency exposure, investors can mitigate a source of risk–but at the expense of a potential source of return. The trade-off between the two is important, and investors’ decisions will depend on a variety of factors, including but not limited to their return requirements, risk tolerance, investment horizon, and the costs associated with hedging currency exposure. Disclosure: Morningstar, Inc. licenses its indexes to institutions for a variety of reasons, including the creation of investment products and the benchmarking of existing products. When licensing indexes for the creation or benchmarking of investment products, Morningstar receives fees that are mainly based on fund assets under management. As of Sept. 30, 2012, AlphaPro Management, BlackRock Asset Management, First Asset, First Trust, Invesco, Merrill Lynch, Northern Trust, Nuveen, and Van Eck license one or more Morningstar indexes for this purpose. These investment products are not sponsored, issued, marketed, or sold by Morningstar. Morningstar does not make any representation regarding the advisability of investing in any investment product based on or benchmarked against a Morningstar index.
A More Tempered Global Equity Fund

By Patricia Oey Low-volatility strategies, such as the iShares minimum volatility family of exchange-traded funds, can be attractive options for long-term investors. This is because these ETFs’ underlying MSCI indexes generally exhibit less-dramatic declines in bear markets . Over the long term, these muted drawdowns explain much of the strategy’s outperformance versus its cap-weighted benchmark. iShares MSCI All Country World Minimum Volatility (NYSEARCA: ACWV ) tracks an index that is designed to be less volatile than its market-cap-weighted parent index–the MSCI All Country World Index (MSCI ACWI). Low-volatility strategies seek to exploit the observed phenomenon that portfolios with smaller price fluctuations tend to outperform portfolios with larger price fluctuations over the long term. This strategy has had a good track record–as measured by the back-tested performance of this fund’s benchmark index (the index’s live performance commenced in November 2009). Over the trailing 15 and 10 years through Dec. 31, 2014, this fund’s underlying index beat the cap-weighted MSCI ACWI by 393 and 202 basis points annualized, respectively. The risk-adjusted returns were also relatively strong, with 15-year Sortino ratios of 0.73 for the minimum-volatility index and 0.22 for the cap-weighted index. However, low-volatility strategies can underperform for long periods of time and tend to lag in bull markets. This fund is suitable for use as a core holding for long-term investors. Typically, global-equity funds are more volatile than U.S. equity funds, as the former have exposure to both international equities and the associated foreign currency fluctuations. But because global equities are a heterogeneous asset class, there is greater diversity (as evidenced by lower correlations) among its constituents, which allows for greater reduction in overall volatility in a fund that employs a minimum-variance strategy such as ACWV. In fact, the trailing five-year standard deviation of returns for this fund’s index of 9% was significantly lower than the S&P 500’s 13% during that same span. Part of this is due to the benchmark’s lower drawdowns during bear markets. For example, in 2008, when the MSCI ACWI fell 42%, this fund’s benchmark declined 25%. This fund does not hedge its currency exposure, so its returns reflect both asset-price changes and changes in exchange rates between the U.S. dollar and other currencies. In the 10-year period through December 2012, a rising euro, followed by a rising yen (against the U.S. dollar), helped boost the performance of this fund. However, more recently, the rising dollar has hurt the fund’s performance. Fundamental View Historically, low-volatility stocks have outperformed high-volatility stocks over the long term. This “volatility anomaly” was first discovered in 1968 by Bob Haugen, who theorized that behavioral factors were behind this phenomenon. More specifically, investors tend to chase risky stocks, expecting these companies to deliver higher returns. This drives up stock prices of riskier names, which ultimately results in weaker future returns, relative to less-volatile names. Generally, this fund had been heavy in less-volatile sectors including consumer staples, health care, telecoms, and utilities, and light in cyclical sectors including financials, technology, energy, and materials, relative to its parent index (MSCI ACWI). In 2013, the fund’s greater exposure to less-volatile names in the United States and Japan weighed on its performance (relative to the MSCI ACWI), as higher-beta names outperformed in those markets. However, in 2014, the fund’s underweighting in the energy sector boosted this fund’s performance (relative to MSCI ACWI). At this time, dividend-oriented sectors such as consumer staples and utilities have been bid up in the recent low-rate environment, and sectors such as materials and energy are trading at low valuations. This fund’s tilt toward more-expensive sectors and tilt away from cheaper sectors may weigh on future performance. About 50% of this fund’s assets are invested in U.S. equities. As of the first quarter of 2015, the U.S. economy appears to be on stable footing. However, now that the U.S. Federal Reserve’s quantitative-easing program has ended, there is uncertainty on how monetary policy will be managed and how it might ultimately affect asset prices–especially considering that valuations across most major asset classes appear to be somewhat stretched. This fund’s second-largest country allocation is Japan, at 12%. After two “lost decades,” Japan’s equity markets responded very enthusiastically to Prime Minister Shinzo Abe’s programs to jump-start the Japanese economy. At the start of 2013, Japan’s Central Bank unleashed an aggressive monetary easing program. This move provided the foundation for improving macroeconomic fundamentals and corporate earnings growth. Japanese equities may also benefit as Japan’s $1.2 trillion public pension raises allocations in domestic equities and away from low-yielding government bonds. However, any sustainable growth in Japan will require difficult-to-implement structural reforms to address Japan’s inefficient labor market and protected private sector. In addition, Japan’s aging population and massive 200% debt/gross domestic product ratio are two issues that likely will weigh on Japan’s growth in the years to come. European equities comprise 10% of this fund’s portfolio. Many European large caps are high-quality, multinational corporations that have benefited from improving productivity, cheap financing, and exposure to faster-growing emerging markets during the past few years. Most of these firms are in good financial shape. This fund’s largest European country allocations are Switzerland and the United Kingdom, and it has an underweighting (relative to the cap-weighted benchmark) in eurozone countries, such as France and Germany. Portfolio Construction This fund employs full replication to track the MSCI ACWI Minimum Volatility Index, which attempts to create a minimum-variance (or lowest-volatility) portfolio of 350 holdings selected from its parent index, MSCI All Country World Index. It does this using an estimated security covariance matrix (the Barra Global Equity Model) and a number of constraints to limit turnover, ensure investability, and maintain sector and country diversification. This index methodology is somewhat of a black box, as data are not available regarding the estimated risk inputs used for the covariance matrix. The index (and fund) is rebalanced twice a year in May and November. ACWV’s portfolio represents about 20% of its parent index, which includes about 2,400 securities. During the past decade, this minimum-volatility index had a correlation of 0.92 to its parent index. But during the past three years, this correlation was lower, at 0.79. This index was launched in November 2009, so data prior to the initial calculation date reflect hypothetical historical performance. Fees This fund charges an annual expense ratio of 0.20%, which is composed of a management fee of 0.33% and a fee waiver of 0.13%. According to iShares, the fee waiver may be reduced or discontinued at any time without notice. During the past three years, the fund outperformed its benchmark by 16 basis points annualized. This is partly due to the fact that the fund’s benchmark incorporates aggressive foreign tax withholding assumptions. In practice, the fund has had lower foreign tax withholding relative to the estimates incorporated in its benchmark. Dividends are paid out quarterly, and in 2013 and 2012, 86% and 71% of this fund’s dividends were classified as qualified by the Internal Revenue Service, respectively (dividends from companies in certain countries are not considered qualified). Investors should note that some of the dividends paid by stocks in the fund are subject to foreign tax withholding. Investors can claim their portion of the withheld taxes as a tax credit, but only if they hold this fund in a taxable account. Alternatives One similar option is Vanguard Global Minimum Volatility (MUTF: VMNVX ) . Similar to the iShares fund, this Vanguard fund employs quant models to construct a low-volatility portfolio. Key differences are: The Vanguard fund hedges out foreign-currency exposure and has a mid-cap tilt, whereas the iShares fund does not hedge out foreign-currency exposure and has a large-cap tilt. This Vanguard fund is relatively new; its inception was in December 2013. The Admiral share class carries an annual expense ratio of 0.20%. IShares has a suite of low-volatility strategies that cover the different segments of the global equity universe. These ETFs include iShares MSCI USA Minimum Volatility (NYSEARCA: USMV ) , iShares MSCI Emerging Markets Minimum Volatility (NYSEARCA: EEMV ) , iShares MSCI EAFE Minimum Volatility (NYSEARCA: EFAV ) , iShares MSCI Japan Minimum Volatility (NYSEARCA: JPMV ) , iShares MSCI Asia ex Japan Minimum Volatility (NYSEARCA: AXJV ) , and iShares MSCI Europe Minimum Volatility (NYSEARCA: EUMV ) . A solid core allocation option is Vanguard Total World Stock ETF (NYSEARCA: VT ) . This fund tracks the FTSE Global All Cap Index, which seeks to cover 98% of the world’s total investable stock market capitalization and includes approximately 7,500 securities. It has an expense ratio of 0.18%. Disclosure: Morningstar, Inc. licenses its indexes to institutions for a variety of reasons, including the creation of investment products and the benchmarking of existing products. When licensing indexes for the creation or benchmarking of investment products, Morningstar receives fees that are mainly based on fund assets under management. As of Sept. 30, 2012, AlphaPro Management, BlackRock Asset Management, First Asset, First Trust, Invesco, Merrill Lynch, Northern Trust, Nuveen, and Van Eck license one or more Morningstar indexes for this purpose. These investment products are not sponsored, issued, marketed, or sold by Morningstar. Morningstar does not make any representation regarding the advisability of investing in any investment product based on or benchmarked against a Morningstar index.