Tag Archives: japan

The Complete Guide To Consumer Staples ETFs

The consumer staple sector showed great improvement in the first half of 2015 on the back of moderate economic recovery, better job prospects, improved business and renewed optimism as a result of the housing recovery. Rising wages and cheaper fuel were the other positives. With oil and natural gas prices subsiding, consumers are left with more disposable income. Commodity costs have in many cases stabilized, which have improved profit margins for certain staples companies. Consumers are also expecting lower inflation primarily due to lower gas prices. However, the continued appreciation of the U.S. dollar relative to most foreign currencies acted as a near-term headwind to the earnings of U.S.-based staples companies with significant international operations. Other risks included potential price wars, a competitive environment, slowdown in international markets (including continued slowdown in China), political turmoil in Russia, sluggishness in Japan and an unfavorable economic environment in Europe. Industry players like McCormick & Co., Inc. (NYSE: MKC ), Energizer Holdings, Inc. (NYSE: ENR ), General Mills, Inc. (NYSE: GIS ), Molson Coors Brewing Co. (NYSE: TAP ), Tyson Foods, Inc. (NYSE: TSN ) have posted positive earnings surprises of 9.4%, 14.5%, 4.5%, 7% and 2.7%, respectively, in their recently reported quarters. On the contrary, Monster Beverage Corporation (NASDAQ: MNST ) and Sysco Corp. (NYSE: SYY ) fell short of their respective Zacks Consensus Estimate, mainly due to currency headwinds. Hopefully, the second half of the year will prove to be better for these companies with a strong rebound in earnings. Given the defensive nature of this sector, it will outperform when equity markets are more bearish and underperform when bullish. The ups and downs of the sector due to the U.S. and global exposure can be played with a wide array of ETFs. The ETFs can act as an excellent investment medium for those who wish to take a long-term exposure within the consumer staples sector. For those interested in taking a look at consumer staples, we have highlighted a few ETFs tracking the industry, any of which could be an interesting pick: Consumer Staples Select Sector SPDR ETF (NYSEARCA: XLP ): Launched on December 16, 1998, XLP is an ETF that seeks investment results corresponding to the S&P Consumer Staples Select Sector Index. This fund consists of 39 stocks of companies that manufacture and sell a range of branded consumer packaged goods, with the top holdings being The Procter & Gamble Co. (NYSE: PG ), The Coca-Cola Company (NYSE: KO ) and Philip Morris International, Inc. (NYSE: PM ). The fund’s expense ratio is 0.15% and it pays out a dividend yield of 2.56%. XLP had about $7.37 billion in assets under management as of July 2, 2015. Vanguard Consumer Staples ETF (NYSEARCA: VDC ): Initiated on January 26, 2004, VDC is an ETF that tracks the performance of the MSCI US Investable Market Consumer Staples 25/50 Index. It measures the investment return of large-, mid-, and small-cap U.S. stocks in the consumer staples sector. The fund has a total of 101 stocks, with the top three holdings being Procter & Gamble, Coca-Cola and PepsiCo, Inc. (NYSE: PEP ). It charges 0.12% in expense ratio, while the yield is 1.91% as of now. VDC has managed to attract $2.8 billion in assets under management till May 31, 2015. First Trust Consumer Staples AlphaDEX (NYSEARCA: FXG ): FXG, launched on May 8, 2007, follows the equity index called StrataQuant Consumer Staples Index. FXG is made up of 40 consumer staples securities, with the top holdings being The WhiteWave Foods Company (NYSE: WWAV ), Pilgrim’s Pride Corporation (NASDAQ: PPC ) and CVS Health Corporation (NYSE: CVS ). The fund’s expense ratio is 0.67% and the dividend yield is 1.55%. It had $2.62 billion in assets under management as of July 2, 2015. Guggenheim S&P 500 Equal Weight Consumer Staples (NYSEARCA: RHS ): Launched on November 1, 2006, RHS is an ETF that seeks investment results corresponding to the S&P 500 Equal Weight Index Consumer Staples. This is an equal-weighted fund and constitutes 37 stocks, with the top holdings being ConAgra Foods, Inc. (NYSE: CAG ), Monster Beverage Corp. ( MNST ) and Reynolds American, Inc. (NYSE: RAI ). The fund’s expense ratio is 0.40% and it pays out a dividend yield of 1.81%. RHS had about $271.0 million in assets under management as of Jul 6, 2015. Fidelity MSCI Consumer Staples ETF (NYSEARCA: FSTA ): FSTA, launched on October 21, 2013, is an ETF that seeks investment results corresponding to MSCI USA IMI Consumer Staples Index. This is a cap-weighted fund and constitutes 100 stocks, with the top holdings being Procter & Gamble, Coca-Cola and PepsiCo. The fund’s expense ratio is 0.12% and the dividend yield is 2.67%. FSTA had about $147.1 million in assets under management as of June 30, 2015. Original Post
Time To Buy Japanese Stocks? Why Not The Yen?

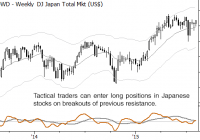
Some trades are obviously simple on the surface: if we think the S&P 500 is going up, we buy the S&P 500. Yes, there are questions to be answered: how much? How do we know we are wrong? Where are we getting out if we’re right? These are important questions, but the essence of the trade is simple – buy the thing we think is going up. Sometimes, though, even the question of what to buy (or sell) – what the appropriate instrument for the trade – can be complicated. A client and friend of mine sent me a note this morning asking about a trade I put on in Japanese stocks. I suggested buying the Nikkei 225 futures (which are not the most liquid market in the world, sometimes) on a breakout, and that US-based investors might want to consider ETF alternatives. His question was… well, rather than paraphrasing, here’s his question: the chart [of the Nikkei average] looks a lot like the USDJPY chart, i.e. strength in Japan seems to be caused by weakness in JPY. Wouldn’t it be less complex to simply use USDJPY? Conceptually the same question arises for set-ups in mining (NASDAQ: RGLD ) or oil stocks etc. Now, I have to basically agree with everything he says there (with the exception of one nitpicking, but critical point). The chart of the Nikkei (below) does, in fact, look a lot like the USDJPY. Here, though, is my point of contention: it’s not quite right to think that strength in Japan is “caused by” weakness in the Yen. One of the best pieces of advice is to be very careful of the phrase “caused by” whenever you are thinking about markets. Do not assume causative links, and check any assumptions carefully. A lot of money has been lost by traders (and made by writers) who oversimplify and assume causative connections that might not be real. A good setup for a long trade on the weekly chart This is not just an academic point; it goes straight to the heart of what we’re trying to do with this trade. I want long exposure to the global equity market that appears to be best set to break out. I want to buy the relative strength leader, ideally before everyone else sees that it’s the leader! That’s what I’m trying to accomplish with this trade, and the most direct way is simply to buy that index. Simple really is better. People tend to over-complicate, particularly in portfolio management, and this can result in complicated trades that don’t do what we expect. For instance, the trader thinking he is “getting gold” by buying something like GDX is getting a mix of gold and stock exposure; he might be disappointed to see GDX go down if gold goes up but stocks go down. These types of complicated trades also carry risks we don’t understand. I’ll write more on this topic of “factor exposure” in portfolio construction and long-term investing, but let me leave you with one last thought about the Japan trade: When we compare global stock indexes, we need to do so with them priced in a common base currency. Because I’m in the US, I look at all stock indexes priced in USD. (Otherwise, we’re looking a combination of currency and stock factors every time we look at a market.) When we execute the trade, we can make a choice to accept the currency risk or hedge it, but we must be aware of the issues and risks involved. This trade provides a good example of the idea of simplicity and the dangers of over complicating. No one would deny that currencies have an impact on stock prices (though we could debate about what, exactly, that impact is), but this is a simple trade. We want long exposure to Japanese stocks with an appropriate risk point. In most cases, we are better off if we don’t get sidetracked by charts that look similar or other potential influences – simply execute the trade in the simplest, most direct way possible.

Does X Mark The Spot?

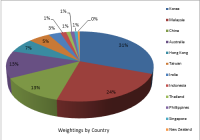
Heavily weighted towards cyclically sensitive sectors. The fund has holdings in top Asia-Pacific companies, excluding Japan. The exclusion of the Japanese economy doesn’t seem to serve any purpose. From its recovery after an ill-conceived, devastating global conflict, Japan underwent a complete restructuring under the leadership of Prime Minister Hayato Ikeda in the 1950s. The constitution was rewritten and modernized, heavy industry and infrastructure was reconstructed, bank regulations were eased and protectionist policies were instituted in order to focus on rebuilding the economy, organically. By the 1960s, referred to by economist as Japan’s ‘golden 60s’, the economy took off and continue to expand, from about $91 billion in 1965 to well over an astonishing $1 trillion by 1985. However, as often happens when left unchecked, growth became unsustainable leading to an asset bubble, which collapsed in 1989. For the next 25 years the economy was trapped in deflationary stagflation, during which time, plan after plan failed to re-inflate the economy. During this same period, the People’s Republic of China was in the process of transitioning from a communist agrarian economy to a more global free market industrial economy with great success. Other countries in the region benefited from the commodity demand generated; Australia, India, Korea, Taiwan, Singapore, India and New Zealand, to name a few. Indeed, Japan still plays a leading role on the Asia Pacific stage, but is no longer the sole regional super-economy. In our present time the Asia-Pacific region has developed into an astonishingly productive and efficient contributor to the entire global economy, with several regional trillion dollar economies. So the question becomes, how well do the Asian Pacific funds perform when Japan is removed from the equation? First, using the Seeking Alpha ETF Hub, and filtering Global/Intl Equities by positive one-year performance results with several ‘ex-Japan’ funds. Excluding ‘specialized’ funds, like ‘Ultras’, ‘Small Cap’, ‘Enhanced’ and the like leaves a few plain vanilla, Asia ex-Japan funds summarized in the table below. ( Data from respective fund websites ) In this category, the Deutsche X-Tracker MSCI Asia Pacific ex Japan Hedged EquityETF ( DBAP ) , as the name suggests includes Asia Pacific economies, excluding Japan. Although hedged, this does not entirely eliminate currency risk, but will dampen currency volatility. (Data from X-Trackers) The fund is most heavily weighted in Financials, 30%, followed by Information Technology, 25%; Industrials, 6%; Materials, 5%; Telecom Services, 4%; Consumer Discretionary, 5%; Consumer Staples, 4%; Energy, 4%; Utilities, 3% and Healthcare at 13%. (Data from X-Trackers) It’s also interesting to note the heaviest sector weightings by country. Australia has the heaviest weightings in Consumer Staples, Financials, Health Care and Materials. China holds the heaviest weightings in Energy, Industrials, Telecom, and Utilities. Hong Kong leads the way in Consumer Discretionary and Korea weights most in the IT sector. This is important to note. China and Australia are major trade partners. Slowing demand in China means a slower Australian economy. Australia has its heaviest weightings are mostly defensive with just one very cyclical sector, Materials. (Data from X-Trackers) At this point, a few words need to be said for the trade dynamic in the region. Japan’s major export partners in the region are China, South Korea, Thailand, Hong Kong, Indonesia, Australia, Singapore and Malaysia. Top export products include Cars, Vehicle Parts, Industrial Printers, Specialized Machinery, Construction Equipment and numerous other industrial products. Hence, by omitting Japan, a major industrial manufacturer, supplier and regional economic contributor, that is to say, a potential major contributor to the fund’s performance is omitted. Excluding the Asia-Pacific region, Japan’s second largest import partner is the United States. Even a slow US economy will conduct sizable trade with Japan, particularly in durable goods. Hence, by omitting Japanese industry from the fund, a major factor is omitted. (It should be noted that other non-Asia-Pacific top export partners include Germany, Mexico, Russia, Canada and the U.K.). (click to enlarge) (Data from OEC) Japan is an integral part of the Asia-Pacific region. Even if the Japanese economy is excluded, its presence implicitly impacts the region, hence the fund, to some extent. China, Australia, Singapore, Hong Kong, New Zealand, South Korea and Indonesia, are developed or recently emerged economies. So excluding Japan does not make this an ’emerging market’ fund, nor can it be really be considered a ‘regional economy’ fund without Japan. The fund seems to be structured on the premise that Japan is the leading economy in the region, whose metrics overwhelm the other regional economies. However, by any measure, Japan fits right in with the locals. The point being is that when compared to its regional neighbors, there is nothing overly exceptional nor detracting about the Japanese economy which dominates the region, necessitating its exclusion. (click to enlarge) The fund trades in a rather strong premium to NAV range: mostly 0.5% to 1.0% and at times as much as 1.5% to 2.0% of NAV, rarely trading at a discount to NAV. Also, management fees are slightly on the high side with a net expense ratio of 0.60%. The fund has been trading since October of 2013. Naturally, before making any investment, it’s always worth reading the fund’s prospectus . Disclosure: I/we have no positions in any stocks mentioned, and no plans to initiate any positions within the next 72 hours. (More…) I wrote this article myself, and it expresses my own opinions. I am not receiving compensation for it (other than from Seeking Alpha). I have no business relationship with any company whose stock is mentioned in this article. Additional disclosure: “CFDs, spread betting and FX can result in losses exceeding your initial deposit. They are not suitable for everyone, so please ensure you understand the risks. Seek independent financial advice if necessary. Nothing in this article should be considered a personal recommendation. It does not account for your personal circumstances or appetite for risk.”