Tag Archives: investment
Today’s Most Competitive Emerging Country ETF Investment
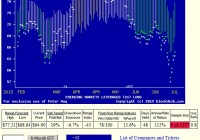
Summary From a population of some 350 actively-traded, substantial, and growing ETFs this is a currently attractive addition to a portfolio whose principal objective is wealth accumulation by active investing. We daily evaluate future near-term price gain prospects for quality, market-seasoned ETFs, based on the expectations of market-makers [MMs], drawing on their insights from client order-flows. The analysis of our subject ETF’s price prospects is reinforced by parallel MM forecasts for each of the ETF’s ten largest holdings. Qualitative appraisals of the forecasts are derived from how well the MMs have foreseen subsequent price behaviors following prior forecasts similar to today’s. Size of prospective gains, odds of winning transactions, worst-case price drawdowns, and marketability measures are all taken into account. Today’s most attractive ETF Is the ProShares Ultra MSCI Emerging Markets ETF (NYSEARCA: EET ). Yahoo Finance profiles this ETF as follows: The investment seeks daily investment results, before fees and expenses, that correspond to two times (2x) the daily performance of the MSCI Emerging Markets Index®. The fund invests in securities and derivatives that ProShare Advisors believes, in combination, should have similar daily return characteristics as two times (2x) the daily return of the index. The index includes 85% of free float-adjusted market capitalization in each industry group in emerging market countries. The fund is non-diversified. The fund currently holds assets of $37.5 million and has had a YTD price return of +1.9%. Its average daily trading volume of 14,205 produces a complete asset turnover calculation in 41 days at its current price of $64.90. A typical bid~offer spread is 0.6%. Behavioral analysis of market-maker hedging actions while providing market liquidity for volume block trades in the ETF by interested major investment funds has produced the recent past (6 month) daily history of implied price range forecasts pictured in Figure 1. Figure 1 (used with permission) The vertical lines of Figure 1 are a visual history of forward-looking expectations of coming prices for the subject ETF. They are NOT a backward-in-time look at actual daily price ranges, but the heavy dot in each range is the ending market quote of the day the forecast was made. What is important in the picture is the balance of upside prospects in comparison to downside concerns. That ratio is expressed in the Range Index [RI], whose number tells what percentage of the whole range lies below the then current price. Today’s Range Index is used to evaluate how well prior forecasts of similar RIs for this ETF have previously worked out. The size of that historic sample is given near the right-hand end of the data line below the picture. The current RI’s size in relation to all available RIs of the past 5 years is indicated in the small blue thumbnail distribution at the bottom of Figure 1. The first items in the data line are current information: The current high and low of the forecast range, and the percent change from the market quote to the top of the range, as a sell target. The Range Index is of the current forecast. Other items of data are all derived from the history of prior forecasts. They stem from applying a T ime- E fficient R isk M anagement D iscipline to hypothetical holdings initiated by the MM forecasts. That discipline requires a next-day closing price cost position be held no longer than 63 market days (3 months) unless first encountered by a market close equal to or above the sell target. The net payoffs are the cumulative average simple percent gains of all such forecast positions, including losses. Days held are average market rather than calendar days held in the sample positions. Drawdown exposure indicates the typical worst-case price experience during those holding periods. Win odds tells what percentage proportion of the sample recovered from the drawdowns to produce a gain. The cred(ibility) ratio compares the sell target prospect with the historic net payoff experiences. Figure 2 provides a longer-time perspective by drawing a once-a week look from the Figure 1 source forecasts, back over two years. Figure 2 (used with permission) What does this ETF hold, causing such price expectations? Figure 3 is a table of securities held by the subject ETF, indicating its concentration in the top ten largest holdings, and their percentage of the ETF’s total value. Figure 3 (click to enlarge) Source: Yahoo Finance This shows how leveraged ETFs do their magic. The top ten holdings of EET are mainly swaps contracts in the iShares MSCI Emerging Markets ETF (NYSEARCA: EEM ), with a value per share of 184.57% of the EET share. The 4.01% in bonds helps balance out the 2x relationship of price change in EET with the underlying Emerging Markets Index security. But that doesn’t tell much about what the investor has driving his investment. To find that out, we look at the holdings of EEM: Source: Yahoo Finance That’s better, and shows the emphasis on Financial Services and Technology, making up almost half of the portfolio. Unfortunately, the offshore nature of virtually all the underlying equity holdings are ones that we do not have information support from arbitrage activities in derivative markets, so our analysis of this dimension of EET must stop here. In markets as unpredictably dynamic as this, wide variations in market experience seem to be the rule. A comparison of the data row for EET from Figure 1 with a similar one from an ETF proxy for the U.S. market helps to highlight the unique and attractive features of EET. For EET: For the SPDR S&P 500 Trust ETF (NYSEARCA: SPY ) : The Sell Target for EET offers 3 times as much potential gain as the U.S. market proxy, SPY. But it exposes the investor to worst-case price drawdown exposure that is more than twice as large. Still, taking Sell Target and Drawdown as Reward and Risk elements, EET is favored with a ratio of 3 to 1, rather than SPY’s 2 to 1. Just as importantly, the ability to recover from extreme price drawdowns and achieve some or all of the upside potential is indicated by each one’s Win Odds out of 100. For the U.S. market proxy that desired objective has been accomplished 7 out of every 8 times. EET has achieved it a bit better than 6 out of 8. But the payoff for EET at a net (including losses) average of +15.6% is 5 times bigger than the U.S. market’s +3.5%. Since both alternative investments took 9-10 weeks to achieve their gains, the Annual Rates of Return [AROR] from price change gains is also 5 times better, 115% to 21%. EET’s relatively small sample of prior experiences, only 9 in the past 5 years is not surprising or troubling, given its presently depressed price, relative to its forecast. That is measured by its Range Index. When negative, it tells by how much the current market quote is below the least justifiable forecast price. Here a -43 means it is cheap by nearly half its total forecast price range. The U.S. market proxy, on the other hand is presently priced right about at its mid-point, with only slightly more upside than downside. A quick reference to the small thumbnail picture in Figure 1, of the past 5 years distribution of Range indexes, emphasizes how extreme (and opportune) is the current pricing. Conclusion EET provides attractive forecast price gains, supported by a recognized index of major established investments in emerging countries. The daily forecast graphic and its weekly extracts over the longer period of two years demonstrate the cyclic nature of the ETF. Its dynamic character offers an opportune point in time to take advantage of world events that may be distracting investors’ attention from the potentials presented here. Disclosure: I/we have no positions in any stocks mentioned, and no plans to initiate any positions within the next 72 hours. (More…) I wrote this article myself, and it expresses my own opinions. I am not receiving compensation for it (other than from Seeking Alpha). I have no business relationship with any company whose stock is mentioned in this article.
The IQ Merger Arbitrage ETF: A Unique ETF With A Built-In Downside Hedge

Summary I conducted a review of the IQ Merger Arbitrage ETF. I found that the IQ Merger Arbitrage ETF has significantly outperformed its peers because of the underlying strategy the ETF uses. In addition, the IQ Merger Arbitrage ETF has outperformed stocks on bonds during big down days. In this article, I will be reviewing the IQ ARB Merger Arbitrage ETF (NYSEARCA: MNA ) as an option for investors looking for a fund that is not highly correlated with stocks or bonds. I believe MNA is an ETF that investors can hide out in when the market panic sells like this past week with the crisis flavor of the week Greece, Puerto Rico, etc. MNA fits well into most portfolios because of the low correlation it has to stocks and bonds. The table below shows MNA is inversely correlated to the iShares Core Total U.S. Bond Market ETF (NYSEARCA: AGG ) and only has a 36% correlation to the SPDR S&P 500 Trust ETF (NYSEARCA: SPY ). With the bond market and the stock market in significant bull markets, there is a real possibility that both stocks and bonds could fall at the same time, which means non-correlated funds have the potential to be an intriguing addition to portfolio for diversification. MNA AGG SPY MNA 1 AGG -0.07 1 SPY 0.36 -0.11 1 Fund Investment Strategy MNA invests in companies that have been publicly announced as acquisition targets and hedges those positions with a broad market short hedge. When a deal is announced, there is a spread between the current trading price and the actual deal price. For example, stock XYZ is acquired for $50/share and after the announcement, XYZ is trading at $49/share. MNA would invest in shares of XYZ and capture the $1 difference between the acquisition price and the current price. As I will detail below in the performance section, MNA has a vastly different return profile than its competitors because it uses a broad market hedge instead of shorting specific stocks, which the competitors for MNA do. This is extremely important given current market conditions, because many companies that are making the acquisitions and thus the companies in the ProShares Merger ETF ( MRGR) and the Credit Suisse Merger Arbitrage Liquid Index ETN ( CSMA) are shorting increasingly along with the acquired company. The following chart shows a real-life example with CSMA having a long position in Time Warner Cable (NYSE: TWC ) and short position in Comcast (NASDAQ: CMCSA ). I assumed that CSMA purchased TWC on the day the deal was announced and showed the performance until April 24th of this year when the deal was called off. As you can see, this was a losing trade for CSMA because Comcast had a better performance than Time Warner Cable, which means that CSMA shorted the better performing company. (click to enlarge) Competition The three main competitors that MNA has are MRGR, CSMA and The Merger Fund (MUTF: MERFX ), which is a mutual fund. Costs: Below is a table, which shows that MNA is only 1 basis point more expensive than MRGR, which is a miniscule difference and is significantly cheaper than CSMA and MERFX. A low expense ratio does not mean that the performance will be better than its more expensive competitors; however, in this case, MNA has significantly outperformed its competitors because of the unique strategy that MNA uses. Expense Ratio MRGR 0.75% MNA 0.76% CSMA 1.05% MERFX 1.27% Performance The following charts show the total return performance of MNA compared to MRGR, CSMA and MERFX, with the charts and data coming from Dividend Channel’s total return calculator . MNA vs. Competitors As you can see in the chart below, MNA has significantly outperformed MRGR since December 2012, which was the start date for MRGR. The performance is not even close, and the funds are going in opposite directions, which shows the strategy MNA uses is superior to MRGR. (click to enlarge) The next chart shows MNA has significantly outperformed CSMA as well since CSMA started trading in October 2010. Up until the start of 2014, MNA and CSMA performed very closely; however, since then, the performance has diverged, because the stocks of the acquiring companies have rose significantly once a merger or acquisition was announced. (click to enlarge) The final chart shows MNA compared to MERFX, which is the widely held $5.3 billion in assets Merger Arbitrage mutual fund. Once again, the same pattern repeated itself with the performance of MNA diverging from the performance of MRFX over the last two years. (click to enlarge) MNA vs. SPY & AGG on worst days Using my ThinkorSwim platform, I looked at the five worst trading days for stocks [SPY] and bonds [AGG] and found that MNA performed well on those days when the broad stock market or bond market was down significantly. As you can see in the table below, the data clearly shows that MNA performs quite well during big down days in the market. SPY MNA AGG MNA 1/15/2015 -1.80% 0.33% 2/6/2015 -0.58% -0.03% 3/6/2015 -1.40% -0.31% 3/2/2015 -0.67% 0.10% 3/10/2015 -1.62% -0.10% 3/6/2015 -0.65% -0.31% 3/25/2015 -1.46% -0.34% 5/11/2015 -0.63% 0.20% 6/29/2015 -2.10% -0.33% 6/22/2015 -0.49% -0.17% Average -1.68% -0.15% Average -0.60% -0.04% Closing Thoughts In closing, I believe MNA is a quality choice for conservative investors who are looking for a non-correlated fund that can be a place to hide out in the event of some foreseen or unforeseen adverse market conditions. MNA is superior to its competitors, because it does not short the stocks of acquiring companies, which has been an excellent strategy in this market, and MNA performs well on days when stocks or bonds are declining significantly. If you are looking for income, MNA is not the fund for you, because MNA only pays an annual dividend if/when they do pay a dividend. Disclaimer: See here Disclosure: I/we have no positions in any stocks mentioned, but may initiate a long position in MNA over the next 72 hours. (More…) I wrote this article myself, and it expresses my own opinions. I am not receiving compensation for it (other than from Seeking Alpha). I have no business relationship with any company whose stock is mentioned in this article. Additional disclosure: I may initiate a position in MNA in the next month or two.