Tag Archives: investing ideas

Lipper Closed-End Fund Summary: July 2015

By Tom Roseen While for the third consecutive month equity CEFs suffered negative NAV-based returns (-0.72% on average for July) and market-based returns (-1.96%), for the first month in three fixed income CEFs were able to claw their way into positive territory, returning 0.45% on a NAV basis and 0.82% on a market basis While the NASDAQ Composite managed to break into record territory in mid-July after a strong tech rally following Google’s surprising second quarter result, as in June advances to new highs were generally just at the margin. Despite signs of improvement in Greece’s debt crisis and on China’s stock market meltdown, investors turned their attention to second quarter earnings reports and began to evaluate the possible impacts slowing growth from China and the global economy will have on market valuations. The markets remained fairly volatile during July. At the beginning of the month rate-hike worries declined slightly after an inline jobs report and soft wage growth were thought to give policy makers an excuse to postpone rate hikes until December. The Labor Department reported that the U.S. economy had added 233,000 jobs for June. And while the unemployment rate declined to 5.3%, most of it was due to people leaving the labor force. With the Chinese market taking back some of its losses and the Greek debt saga appearing to be closer to a resolution, European stocks rallied mid-month. However, later in the month disappointing earnings results from the likes of Apple (NASDAQ: AAPL ), Caterpillar (NYSE: CAT ), and Exxon (NYSE: XOM ) and commodities’ continuing their freefall placed a pall over the markets. Concerns over slowing global growth and the Shanghai Composite’s recent meltdown weighed on emerging markets, sending Lipper’s world equity CEFs macro-group (-1.52%) to the bottom of the equity CEFs universe for the month. While plummeting commodity prices weren’t much kinder to domestic equity funds (-0.80%), investors’ search for yield helped catapult mixed-asset CEFs (+0.77%) to the top of the charts for July. With China suffering its worst monthly market decline in six years, crude oil prices closing at a four-month low, and gold futures posting their worst monthly performance in two years, investors experienced bouts of panic and sought safe-haven plays intermittently throughout the month. At maturities greater than two years Treasury yields declined, with the ten-year yield declining 15 bps to 2.20% by month-end. For the first month in four all of Lipper’s municipal bond CEFs classifications (+1.10%) witnessed plus-side returns for July. However, domestic taxable bond CEFs (-0.13%) and world bond CEFs (-0.98%) were pulled down by investors’ risk-off mentality. For July the median discount of all CEFs narrowed 2 bps to 10.50%-worse than the 12-month moving average discount (9.13%). Equity CEFs’ median discount widened 41 bps to 11.15%, while fixed income CEFs’ median discount narrowed 58 bps to 9.86%. For the month 46% of all funds’ discounts or premiums improved, while 51% worsened. To read the complete Month in Closed-End Funds: July 2015 Fund Market Insight Report, which includes the month’s closed-end fund corporate events, please click here .

Malaysia: Truly A Bear Market

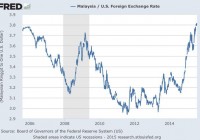
The Trend Is Your Friend for the Malaysia’s stock market and currency. Sell the iShares MSCI Malaysia ETF on worsening economic fundamentals, worsening technicals and worsening sentiment. The looming unwind of the global carry trade and a relatively pricey valuation for EWM means a further 20% drop in price by year end is highly likely. Malaysia is in big trouble. Its currency and stock markets are in bear markets with no sign things getting better any time soon. First of all, the country has weak economic fundamentals. Analysis by the Malaysian Institute of Economic Research, dated 4h August 2015, shows that the important indicators of consumer confidence, retail trade, employment and residential property are all pointing to weaker economic growth conditions. Then there is the country’s deteriorating terms of trade situation. In 2014 commodity exports accounted for 26% of exports and 18% of GDP. With palm oil, crude and refined products and natural gas, Malaysia’s key export commodities all heading lower, this is putting pressure on Malaysia’s fiscal situation. But don’t lower commodity prices hit many emerging markets? Yes, but in actual fact Malaysia is the only country within the Association of South East Asian Nations region that does not benefit from lower oil prices. This means that Bank Negara the country’s central banks will likely need to ease, weakening the ringgit further. This would be a bad development for the iShares MSCI Malaysia ETF (NYSEARCA: EWM ). The ringgit which is at ten year lows and broke though the key technical level of 3.7 ringgits to the dollar is in a strong bear market and monetary policy divergence is set to make the currency weaker. (click to enlarge) Although a weaker currency could help exports in theory, Malaysia has little room for credit expansion to spur domestic consumption and investment. According to the IMF Malaysia’s debt to GDP stands at 165% – one of the highest of all emerging market countries. This means the ” monetary transmission mechanism ” by which lower policy rates should help economic conditions may not be very effective. With EWM dropping from its 52 week high $16.32 to below $12, hasn’t the market already priced in a lot of these negative factors in already? I don’t think so – with a trailing P/E ratio of 16 times, the market is not cheap. Additionally, Malaysian stocks are highly susceptible to a de-rating once the Fed raises interest rates and fast money investors with their global carry trades accelerate their unwinding of risky asset holdings. That’s because as funding costs creep up for carry trades, the risk return of carry trades in Emerging Markets looks increasingly less favorable, and with fast money investors all conscious of the positioning of other like-minded investors it’s likely that they will be inching nearer to the exit door in order to get out first. This situation and a potential rush to sell could lead to a self-fulfilling prophecy in so many of the higher risk and especially commodity linked markets like Malaysia. For EWM the $12 mark was also a key technical level, as it has been both a support and resistance level several times since 2007 – see chart below. The next key technical level appears to be $10. (click to enlarge) Furthermore, global investors have no doubt been troubled by the ongoing scandal in Malaysian politics concerning the Prime Minister Najib Razak’s personal finances. At a time when Japan is steadily improving its corporate governance, other Asian countries need to do everything to keep up on this front because unlike Japan, countries like Malaysia are unable to implement quantitative easing without spurring massive inflation. The key risk to my thesis is if oil prices were to rally hard or if the policy divergence between the Fed tightening and Bank Negara’s likely easing were to turn around. These two scenarios would alleviate the economic fundamentals somewhat and support a market valuation of 16 times earnings in my view. However, I view this outcome as very low probability. The bottom line is Malaysia is a falling knife. There is no catalyst on the horizon which suggests attempting to pick a bottom could be successful. Investors with the ability to short, should short EWM. Long only investors who want exposure to Asia can find better alternatives. Disclosure: I/we have no positions in any stocks mentioned, but may initiate a short position in EWM over the next 72 hours. (More…) I wrote this article myself, and it expresses my own opinions. I am not receiving compensation for it (other than from Seeking Alpha). I have no business relationship with any company whose stock is mentioned in this article.
Plan To Survive: Be Systematic!

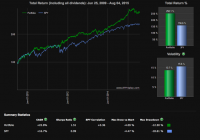
Surviving this environment is tough. Investors need evidence-based methods (EBM). This series will provide some tools. To survive the current investment environment, investors need systematic, evidence-based methods which will skew the odds in their favor. In this series, I will present a variety of strategy indices which my firm has created, which will provide some tools to aid in survival. In a the dog-eat-dog world of the financial markets, solid technology is essential. My firm has created a variety of strategy indices which have pounded the S&P 500, utilized structural forms of alpha creation, and reduced investors’ correlation to the stock market. This year, we will focus on strategies which have a low correlation to both stocks and to bonds. As always, our cutting-edge strategies are only available to subscribers, but I hope that some of the strategy indices presented here will provide inspiration for readers to create their own methods for dealing with an increasingly difficult investment environment. Remember, hope is for people who do not use data. Wise investors plan using evidence-based methods. Please note that even though the rules of this strategy index have been publicly-released, that like any other index, we require the execution of a licensing agreement with ZOMMA LLC for any form of commercial use whatsoever. ZOMMA Quant Warthog II Rules: I. Buy UPRO (NYSEARCA: UPRO ) with 30% of the dollar value of the portfolio. II. Buy TMF (NYSEARCA: TMF ) with 20% of the dollar value of the portfolio III. Buy EUO (NYSEARCA: EUO ) with 40% of the dollar value of the portfolio. IV. Buy UGL (NYSEARCA: UGL ) with 10% of the dollar value of the portfolio. V. Rebalance annually to maintain the 30%/20%/40%/10% dollar value split between the instruments. Here are the results of a backtest of these rules in a log scale: (click to enlarge) (click to enlarge) What is the intuition behind this market-thumping performance? UPRO is a 3X leveraged S&P 500 ETF. TMF is a 3X leveraged 20+ years government bond fund ETN. EUO is a 2X short Euro ETF, and UGL is a 2X leveraged gold ETF. In a flat to bullish environment for bonds, the often inverse nature of stock / bond correlation is well known. Hence the UPRO/TMF inclusion in the index. In addition, since the leverage in the instruments in non-recourse, the use of UPRO/TMF is far safer than the use of margin leverage. Indeed, UPRO/TMF can only go to zero. However, in a rising interest rate environment, long-dated government bonds often get slammed, but the higher interest rates lead the dollar to strengthen. A 2X short Euro ETF is synthetically long the dollar. When U.S. interest rates rise, since this makes the dollar more attractive, EUO should jump with rising real U.S. interest rates. Therefore, EUO acts as a hedge for TMF. In addition, a synthetic dollar long position can be an excellent hedge in a deflationary environment in which the U.S. dollar strengthens. The UGL allocation is for a potential hyperinflation or monetary debasement scenario in which bonds and the dollar get slammed. The 2X leveraged gold ETF has the ability to help in such a scenario. Remember, UGL can jump dramatically, but because the leverage in UGL is inherent to the instrument and non-recourse, it can only go to zero. Indeed, the leveraged nature of the instruments acts like a call option on various asset classes, without the margin leverage inherent in other paradigms such as Risk Parity. This strategy index is truly impressive. It has 6 percentage points less maximum drawdown than the SPY (NYSEARCA: SPY ), while having 6 percentage points more of CAGR. In addition, it accomplishes this feat with only a 0.36 correlation to SPY. Very impressive. But what is this strategy index’s correlation to long-dated government bonds? Here are the results of a backtest of these rules in a log scale: (click to enlarge) The strategy index is only 0.36 correlated to leveraged long bonds as well. Extremely impressive. And with a Sharpe ratio of 1.51, the strategy is a serious tool in the investor’s toolbox. And this strategy index achieves low correlations to stocks and to fixed income, without strong commodity correlation either. Below is a log scale graph of the strategy index’s backtested rules compared to its UGL 2X leveraged gold component: (click to enlarge) The strategy index has only a 0.29 correlation to UGL. To summarize, the index has a low correlation to stocks, to bonds, and to commodities. Therefore, for investors who wisely fear that bear markets in stocks, in bonds, or in commodities could hurt their portfolios, perhaps they should consider an index which offers the chance of a low correlation to all three asset classes. Remember, hope is for people who do not use data. Wise investors plan using evidence-based methods. Solid evidence-based technology goes a long way. At the very least, this index is a valuable tool for conceptualizing issues of correlation and diversification within an evidence-based framework. Thanks for reading. Hypothetical performance results have many inherent limitations, some of which are described below. No representation is being made that any account will or is likely to achieve profits or losses similar to those shown; in fact, there are frequently sharp differences between hypothetical performance results and the actual results subsequently achieved by any particular trading program. One of the limitations of hypothetical performance results is that they are generally prepared with the benefit of hindsight. In addition, hypothetical trading does not involve financial risk, and no hypothetical trading record can completely account for the impact of financial risk of actual trading. For example, the ability to withstand losses or to adhere to a particular trading program in spite of trading losses are material points which can also adversely affect actual trading results. There are numerous other factors related to the markets in general or to the implementation of any specific trading program which cannot be fully accounted for in the preparation of hypothetical performance results and all which can adversely affect trading results. Disclosure: I/we have no positions in any stocks mentioned, but may initiate a long position in SPXL, TMF, EUO, UGL over the next 72 hours. (More…) I wrote this article myself, and it expresses my own opinions. I am not receiving compensation for it (other than from Seeking Alpha). I have no business relationship with any company whose stock is mentioned in this article.